Last week we provided a bearish call on gold. Our view was that rising interest rates amid an economic restart would favor the dollar, which provides a yield, over a shiny precious metal asset that does little more than act as a safe haven.
Conversely, a precious metals peer, palladium, offers a compelling, bullish case. We foresee a resumption of its rally, not only because of its widespread industrial usage, but because a recovery supported by unprecedented fiscal policy that's partially going to be fueled by US President Joseph Biden’s green initiatives will further increase demand for the precious metal as global pollution standards tighten.
Moreover, palladium is in short supply. Commodity analysts expect a tenth year of the ongoing deficit in the precious metal, predicting a rise to $3,000 per ounce, a 12% increase from its current $2,642 price.
We've also identified a technicals-based path for this milestone.

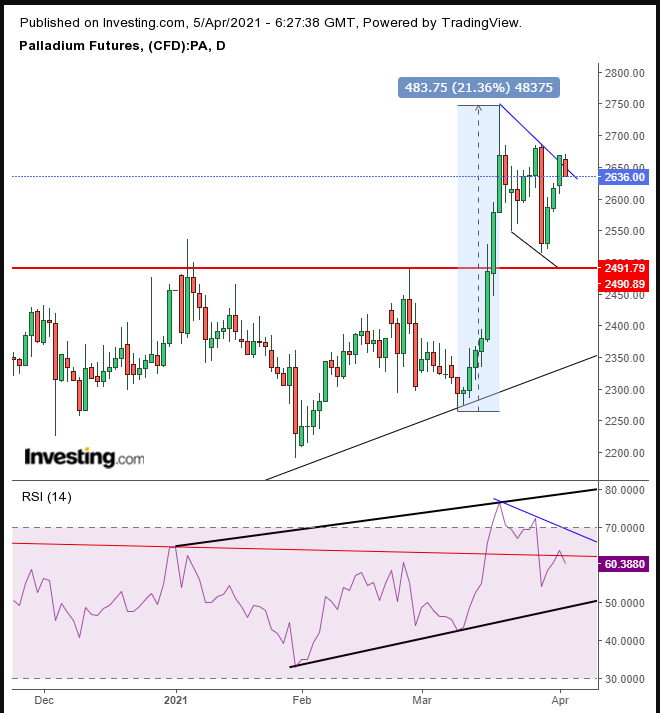
Palladium has been ranging within a falling flag since the Mar. 18 high. The presumed dynamics of the pattern is that of profit-taking that follows a 21% surge in a seven day straight rally, its longest winning streak since the seven-day rally that ended on June 14, 2019.
The powerful rally helped palladium overcome a resistance level since July, and the flag is acting as a market slingshot to overcome the Feb. 27, 2020 all-time high of $2,789.10. Note how the range developed between the $2,500 resistance and the all-time high.
The pause in the uptrend was a chance for traders to catch their breath and regain their bearings. New demand sustained prices. An upside breakout would be proof that demand continues to outweigh supply. This would trigger a causal chain—probably including a short squeeze—which would include triggered longs, followed by widespread speculation, giving the price the market participation required to carve out a new upside slice.
The RSI shows that overall momentum is on the rise. The falling momentum corresponding to the falling flag was a heads-up that the price would find resistance at the flag top, as it is so far, rather than break out. This increases the potential of another wave within the congestion.
A concise topside breakout would signal to early bulls who cashed out that the rally is set to continue, dragging them right back in.
Trading Strategies
Conservative traders should wait for an obvious breakout, with at least a long solid candle, developing fully above the flag, with a close above the Mar. 18 high, that will remain above the flag for a minimum of three days, preferably over the weekend.
Moderate traders could enter a long position upon the breakout, with at least one long candle that's free of the range, which remained above the pattern for at least two days, though they may wait for a buying dip.
Aggressive traders might enter a two-part trade which includes a contrarian short position, given the current resistance and the falling momentary momentum. This would take advantage of a most favorable risk-reward ratio being at the top of the flag, then buying the dip. Caution: this is a risky trade. You should only take it if you understand and accept the risk and have a tight trading plan in place that you know you'll stick to.
Here’s an example:
Trade Sample
Part 1: Contrarian Short
- Entry: $2,650
- Stop-Loss: $2,670
- Risk: $20
- Target: $2,550
- Reward: $100
- Risk:Reward Ratio: 1:5
Part 2: Long Position
- Entry: $2,550
- Stop-Loss: $2,500
- Risk: $50
- Target: $3,000
- Reward: $450
- Risk:Reward Ratio: 1:9
Author's Note: This is a complex, two-part trade. If you didn’t carefully read and fully understand the post and are accepting the risk of a loss that could happen in a leveraged trade even if the analysis and forecast will stand, do NOT take the trade.
Unless you know how to customize a plan that fits your timing, budget and temperament, make only small trades for educational purposes, not profit, or you will end up with neither.
