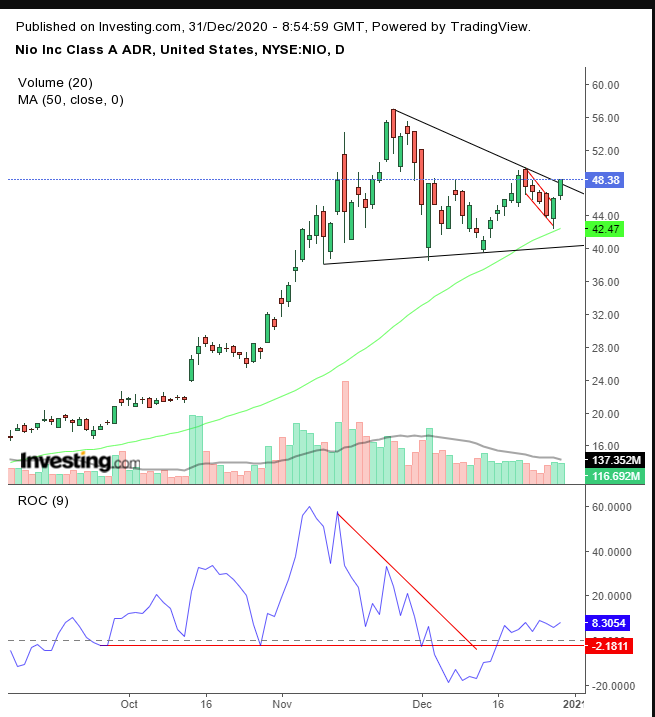
Shares of Chinese electric vehicle manufacturer Nio (NYSE:NIO) have been gaining traction. The stock's rise is the result of recent rumors that Apple (NASDAQ:AAPL) could be partnering with the Shanghai-based company as the iPhone maker—according to an earlier rumor reported by Reuters—targets}} car production.
According to the Reuters' report, Apple plans to launch its own self-driving EV by the end of 2024. Analysts predicted that the Cupertino, California company could partner up with an existing auto manufacturer, like Nio, Xpeng (NYSE:XPEV), Volkswagen (OTC:VWAGY) or even Tesla (NASDAQ:{{13994|TSLA). Since then, the internet has been awash with speculation that Nio is the one.
The old Wall Street adage says, “buy the rumor, sell the news,” but this is a rumor of mega proportions. Though it hasn't been confirmed, the good news is, fundamentally, Nio is still a buy, with or without a strategic partnership with Apple. If the buzz pans out, that would be icing on the cake.
In truth, even if these rumors don't come to fruition, if traders are currently buying these rumors, the stock will go up. Technicals are also signaling Nio is about to leap.

The price completed a falling flag, bullish following a fifth straight advance and a 25% surge from the low of Dec. 14 to the high of Dec. 22, which produced a 'flagpole' measuring $10. That's now the implied move from the flag’s breakout point of $46 to the $56 target.
While the breakout volume rose relative to that of the flag's support, it didn’t quite spike in an obvious manner, as it did on Dec. 2, let alone on Nov. 13. While flag breakouts have not always been accompanied by spiking volume, this moderate volume might have occurred as traders traversed a second layer of market forces, when the price hit the top of a symmetrical triangle.
We hope to see that volume spike again when bulls clear out all that available supply and the larger pattern’s breakout attracts more traders.
You can see how volume increased till the development of the triangle, but has been diminishing since. Also, notice that except for volume on Nov. 13, green-day volume almost always beat red-day volume.
The ROC, a sensitive momentum-based indicator, bottomed. This provided a leading indicator that the price will, as well. The completed flag’s implied target of $56 certainly says the price will also complete the triangle.
Trading Strategies
Conservative traders would wait before going long, for the breakout penetration to close above $50, then complete a return move that verifies the pattern’s integrity.
Moderate traders would either wait for the triangle breakout or await a return move that finds support by the flag before going long.
Aggressive traders would buy at will, provided they had a plan that included entry and exit points offering them a sensible risk-reward ratio.
Here’s an example.
Trade Sample
- Entry: $47
- Stop-Loss: $ $46
- Risk: $1
- Target: $56
- Reward: $9
- Risk:Reward Ratio: 1:9
