Bone-chilling weather throughout a significant portion of the United States over the past few days—including a rare deep freeze accompanied by winter storms across much of the country's south, including the state of Texas—has left millions of people without electricity and taken a toll on the Lone Star state's energy industry. According to Reuters, the storms in Texas, "by far the country's largest crude producer, [is] shutting oil refineries and forcing restrictions from natural gas pipeline operators."
WTI crude, which had recently been hovering above the $60 level, this morning fell back below it, despite the rolling black-outs throughout Texas causing disruption to the production of oil. Sellers took advantage of the psychological round-number resistance and used it as an opportunity to take profits and refocus on natural gas, which has continued soaring because of the unexpected cold and fears of supply disruptions.
March contracts on NatGas jumped 5.5% to $3.073 per MMBtu, with March gasoline following with a 5.3% gain to $1.7813 a gallon.
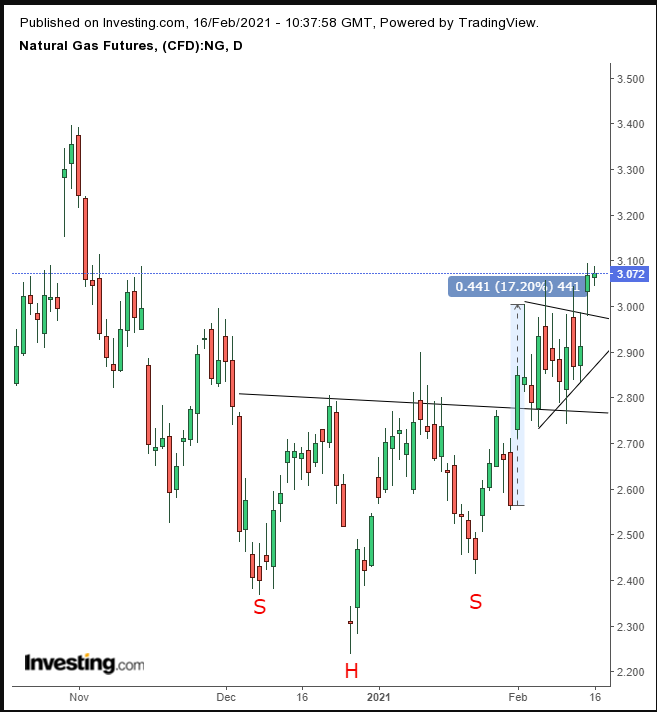
The spike in price helped complete a series of bullish patterns for the energy commodity.

Monday’s surge completed a bullish pennant—a hiatus during which bulls, exhausted from a 17% surge in NatGas, could take profit, while allowing envious bulls who hadn't participated in the previous action to take up positions, in hopes of another leg higher.
The bullish pattern was traded amid a return-move to a H&S bottom. The pennant’s completion solidified the H&S’s bearish implications.
Each bullish pattern’s implied target is based on its height, as the same invested parties who helped build it are expected to infuse it with the same momentum.
While the H&S is larger, with a $0.532 height between its head and point of breakout, it already climbed $0.300 from the point of breakout, while the smaller, $0.441 pennant has just broken out, climbing only $0.080 from its point of breakout.
Therefore, the larger H&S pattern’s target, which started from its lower breakout point, is $3.26, while the smaller pennant’s target’s $3.42. A trader's patience before closing a position with regard to target achievement would be relative to their risk tolerance.
Trading Strategies – Long Position Setup
Conservative traders should wait for the price to remain above the pennant for another two closes, having already achieved the 3% price and 1-day filter, as a way of minimizing the odds of a bull trap. They would also wait for a pullback toward the pennant, to confirm support.
Moderate traders would be content with just another day's close above the pennant; then, like their conservative peers, they'd wait for a return move toward the pennant, for a better entry, if not for further confirmation.
Aggressive traders could enter a long position at will, after having written a coherent trade plan that incorporates their risk tolerance as well as their goals.
Note on Contract Specs: A natural gas contract unit is 10,000 MMBtu. That means that every price movement on the chart will be reflected times 10,000 per single unit in your account. As such, a price change of $0.01 will appear as a change of $100.
Trade Sample:
- Entry: $3.000
- Stop-Loss: $2.970
- Risk: $0.030
- Target: $3.210
- Reward: $0.210
- Risk:Reward Ratio: 1:7
Author's Note: This is a trade sample. It is only designed to illustrate an example of what to include in a basic trading plan. Even if the analysis proves to be correct, the trade sample could fail, and the analysis itself may not work out. If you don’t understand the analysis, don’t trade. Your budget, timing and risk tolerance will impact your trading success. If you don’t know how to customize a trading plan, take many smaller risks, until you acquire the skill.
