US stocks experienced their worst selloff since last week on Thursday, as they ricocheted back and forth on the US-China trade spat, compounded by a Fed bent on tightening rates along with an added bonus in the form of the Italian debt crises.
As if investors didn't already have enough to worry about, earnings shortcomings from industrial companies and Bank of America's move to downgrade the housing sector brought already fraught nerves to a breaking point.
Technology stocks, which are generally the leaders of most sharp market moves, have been leading the recent decline. The technology sector has fallen 1.96 percent, lagging behind all other S&P 500 sectors, while the NASDAQ Composite underperformed the major averages by 2.06 percent.
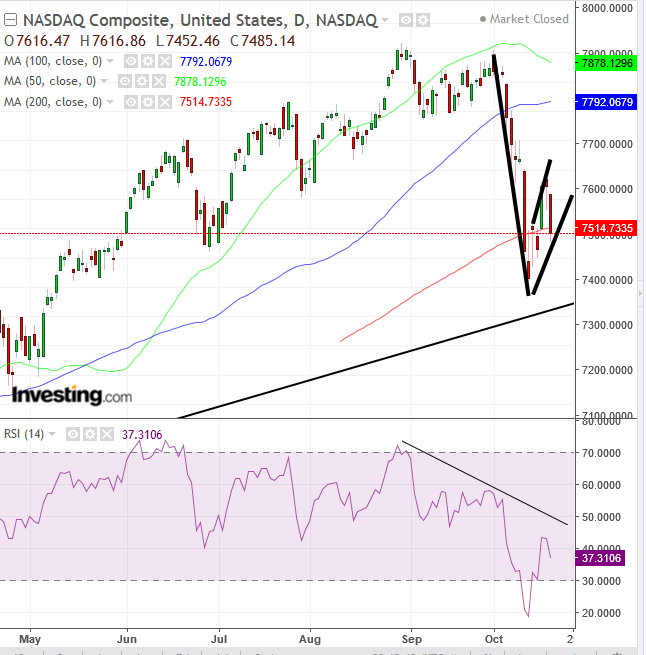
All three major US indices fell below their 200 DMA yesterday, within a bearish flag, right on top of their respective uptrend lines since the February bottom. The Russell 2000 has remained below the 200 DMA since October 10—the same day it crossed below the uptrend line since February 2016. The recent two-day decline successfully retested both the broken uptrend line and the violated 200 DMA, confirming that supply is more significant than demand at these levels, pushing prices down again.
We have mentioned in the past how the Russell’s drop below its uptrend line since the February 2016 bottom is a leading indicator of a market top. On a similar note, we’ll now look at the supply-demand balance of the NASDAQ Composite.

A downside breakout of the rising flag would suggest that supply has absorbed all available demand and is reducing its offer prices to below the pattern to meet willing buyers. While that creates momentum in and of itself, it will expectedly increase as it triggers the long position's stop-loss (which means that demand is taken out of the equation) and steps up speculators' short selling (increasing supply). This is precisely the premise of a bearish domino effect.
This outlook is reinforced with the following technical factors:
- The 200 DMA applies a resistance above the flag.
- A pattern downside breakout will likely include crossing below the uptrend line since February 2016; the opposing trend may have likely caused the momentary balance in supply and demand.
- The RSI has confirmed a falling trend for momentum, which includes a negative divergence to the rising price peaks of August 30 and October 1.
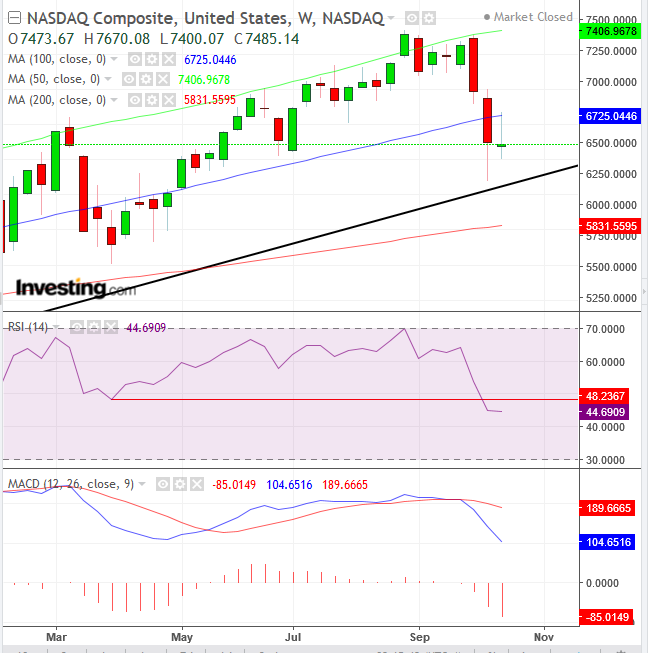
- The Weekly MACD (below) and RSI confirm selloffs. The MACD’s shorter MA fell below the longer MA after a peak. The RSI fell below its 48 support for the first time since early April.

To confirm such trend, an official reversal, which requires at least two descending peaks and troughs, has yet to occur. So far, Wednesday’s high may be considered the second peak since October 1. A second trough, below the October 11 low is required to call a downtrend.
Trading Strategies – Short Position Setup
Conservative traders should wait for a bona fide reversal, with at least a 3 percent penetration of the preceding trough, to avoid a bear trap. Then, they’d wait for a likely return move to confirm the new, downtrend, with at least one long, red candle following a green or small candle of any size.
Moderate traders would wait for a minimum 2 percent downside breakout, to avoid a bear trap, followed by a return move to either confirm that supply has overcome demand, with at least a single, long red candle engulfing a preceding green or small candle of any color, or for a closer entry to the new resistance.
Aggressive traders could enter after a 1 percent penetration. Then, they would wait for the return move, as described above.
