Intel (NASDAQ:INTC) is scheduled to report Q4 2020 earnings today, after the market close. The consensus calls for a $1.10 EPS, versus a $1.52 EPS for the same quarter last year, and $17.45B in revenue, down from $20.21B YoY.
However, we believe there’s a good chance of a positive surprise from the Santa Clara, California-based chip-maker, based on a variety of fundamentals as well as the way its technical chart is setting up.
Yesterday, our colleague, Haris Anwar, detailed the fundamental case}}, which includes the company's announcement last week that it was bringing in a new CEO, as well as management efforts to boost long-term growth, after the semiconductor giant was unseated from its position as the most valuable global chip-maker by NVIDIA (NASDAQ:{{6497|NVDA).
While we agree the stock is likely move higher, we disagree on the rate of that ascent. We believe there's potential for an immediate 15% gain. Here’s why:

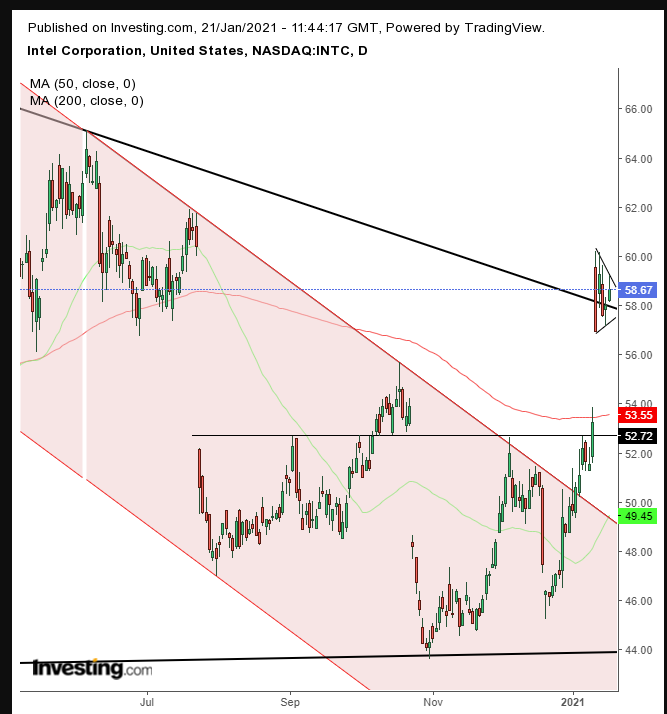
After the 17.4% surge the stock enjoyed after the CEO shakeup was announced, the share price has been contracting within a pennant formation, bullish after such rapid gains.
The reason it’s expected to break to the upside is that the current pause is deemed to be a period in which buyers are locking in extraordinary profits, while newer buyers are taking over long positions, which keeps the price from falling. An upside breakout would validate this view, demonstrating that buyers had acquired all available supply at these prices, and were raising the ante.
Bulls who already got out, because they second-guessed the sharp move, are now kicking themselves for having sold too early and are getting back in. At the same time, short-sellers who were sure the move was exaggerated, have to quickly cover themselves.
Traders who hadn't yet recognized a trajectory, will, at this point, understand where things are headed. The expectation is that, after the upside breakout, most of the market will be betting the stock will keep going higher. As indeed it will.
Additional factors to bolster the technical significance of this pennant: The price formed a breakaway gap, after breaking free of the falling channel (red) since the June high. It has completed a bottom since July, as it skipped over the 200 MA. Note where the continuation pattern is forming—right on the downtrend line since the January 2020 high. After overcoming these four technical obstacles, bulls required a breather.
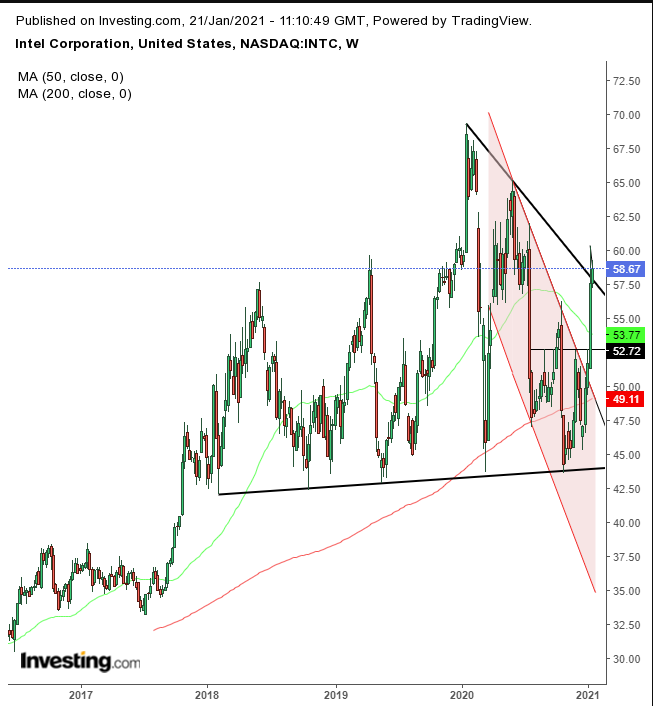
If the pennant does, in fact, provide an upside breakout, buyers will have potentially completed four additional hurdles: (1) Completing a bullish pennant, (2) Overcoming the year-long downtrend line, (3) Possibly blowing out a massive H&S top since June 2018 (see below) and (4) Likely pulling the 50 DMA over the 200 DMA, triggering a golden cross.

Will a 15% follow-through of the pennant formation blowout of the massive H&S top, cause a bullish 50-week MA bounce above the 200-week MA, reinforcing the bullishness of a failed H&S top? It could still turn into a double-top, but that would only mean that our current view of a rally is correct.
All told, this provides a setup for a powerful bullish move, with the company's corporate results being the likely trigger. Charles Kirkpatrick, technical research specialist and author of 'Beat the Market' says the failure rate on this is 19%.
Caveat: We don't know the future. We're merely interpreting the price action based on historical results and our knowledge that the failure rate for pennants is 19%.
Trading Strategies – Long Position Setup
Conservative traders should wait for an upside breakout with a 3-percent penetration, to limit the probability of a bull trap, followed by a return-move that would demonstrate a base of support above the pattern.
Moderate traders would wait for the penetration of the psychological $60 level, then wait for the pull-back, for a better entry, if not to retest the bullish trend.
Aggressive traders could jump in now, anticipating what the technicals point to be a powerful upside move, provided they understand the analysis and accept the added risk of lack of confirmation of the actual breakout, to beat the crowd, for the additional reward. The higher the risk, the tigher the trading plan a trader should commit to.
Here’s one example.
Trading Sample
- Entry: $59
- Stop-Loss: $56
- Risk: $3
- Target: $68
- Reward: $9
- Risk:Reward Ratio: 1:3
Author's Note: This is just a sample, not the analysis itself, which is nothing more than fundamental and technical analysis to manage luck. We do not know what will happen. Rather, we're betting on statistics. Your timing, budget and temperament will also determine the level of a trade's success or failure. If you don’t know how to write a customized trading plan, take small risks while you learn.
