Market Overview
Market Overview
As we move to within one week of the next potentially key milestone in the trade dispute, traders have started Monday’s session on a somewhat cautious note. The unambiguously strong Nonfarm Payrolls report from Friday has quickly lost impetus and the focus is quickly turning back to trade again. According to Donald Trump’s economic adviser, Larry Kudlow, the prospect of further tariffs being implemented on 15th December remains live.
Those traders that monitor USD/CNY as a gauge for developments in the trade dispute will note that the rate has ticked back higher again this morning and remains above 7.00. The latest trade data out of China brings into focus the impact that the dispute is having. China Trade Balance saw the surplus narrow to +$38.7bn in November (+$46.3bn exp, +$42.8bn in October). This came with Chinese exports missing estimates with a fourth consecutive month of decline -1.1% in November (1.0% exp, -0.9% October), although a slight positive came as Chinese imports grew by +0.3% (-1.8% exp, -6.4% October). A cautious reaction is being seen across major markets. Treasury yields have come back from Friday’s highs and on forex, the yen is strengthening again. Equity traders are looking edgy again. However, there is a trade with a one track mind at the moment though, with sterling back on track for strength.
The UK election looms and the Conservatives have a sizeable lead in the polls. This is considered to be positive for pushing the Brexit process forward. A seven month high for cable and two year and seven months highs for sterling against the euro.
Wall Street closed strongly higher on Friday with the S&P 500 +0.9% at 3146, whilst US futures are more cautious today, currently -1 tick lower. The broad cautious sentiment means that Asian markets have been unable to take too much strength, with the Nikkei +0.3% and Shanghai Composite +0.1%. I
n Europe, this is translating to a mild slip back on DAX Futures -0.1%, whilst FTSE futures are taking the added impact of sterling strength and are -0.2% early today.
In forex, caution is weighing marginally on AUD and NZD whilst USD is stuttering. The big outperformer is GBP which is +0.4% versus the dollar.
In commodities, the moves are helping gold find a degree of support with +$2, whilst oil is just off the top from Friday’s gains post OPEC+.
The economic calendar is thin on the ground today. Only really the Eurozone Sentix Investor Confidence for December at 09:30 GMT which is expected to slip back to -4.9 (from -4.5 in November).
Chart of the Day – Silver
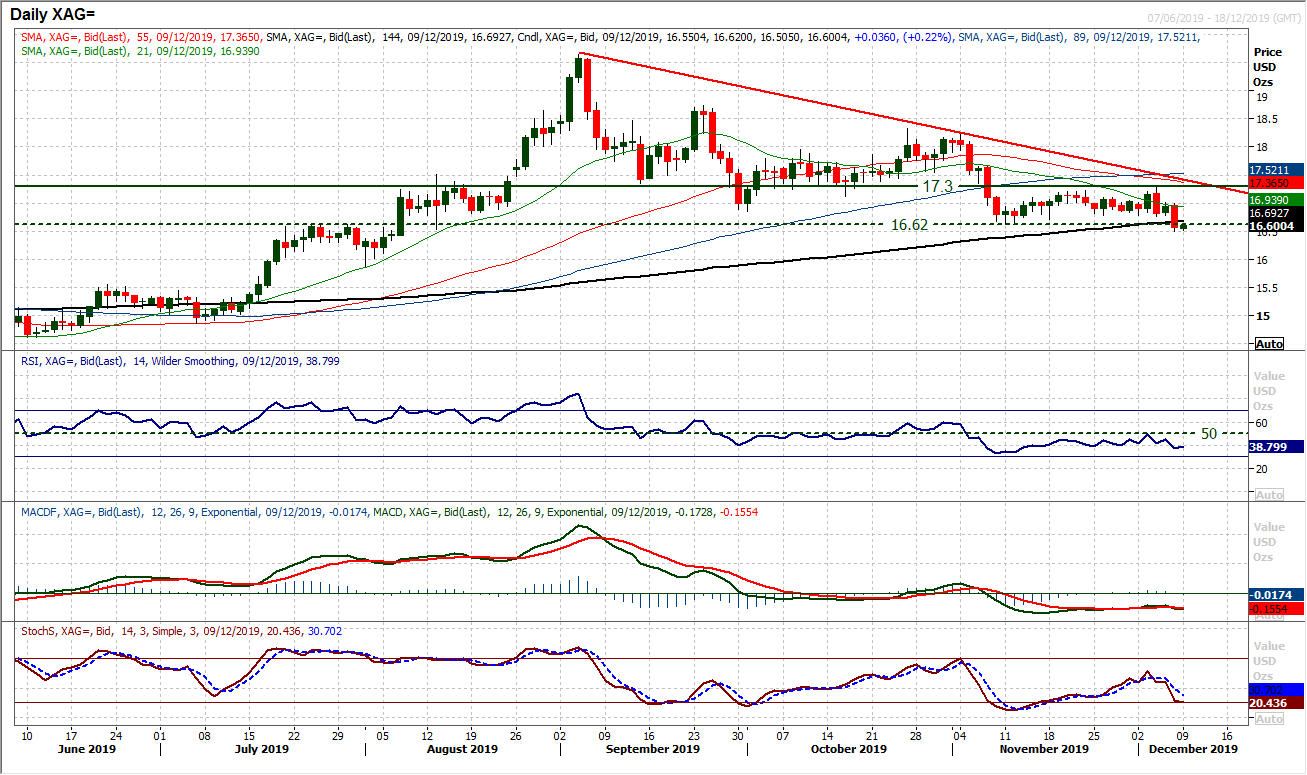
Silver and gold tend to still have fairly similar outlooks, so Silver’s downside break on Friday of the November low at $16.62 will be of concern for the gold bulls. A move to a new four month low comes with the continued trend lower of recent months. Lower highs and lower lows are gradually dragging silver back. Momentum indicators are now consistently correctively configured and rallies are seen as a chance to sell. The RSI is consistently failing around 50 and back under 40, whilst the MACD lines are struggling under neutral and turning lower again, as Stochastics have now crosses back lower. The latest failure early this week around $17.30 and a band of overhead supply has come with a decisive move lower in recent sessions. This suggests that coming into the new week, that near term rallies remain a struggle for positive traction. The hourly chart shows resistance around $16.75/$16.85 now and is a near term sell zone. The falling 21 day moving average is also a decent gauge and is falling today at $16.94. The next support is $15.88.
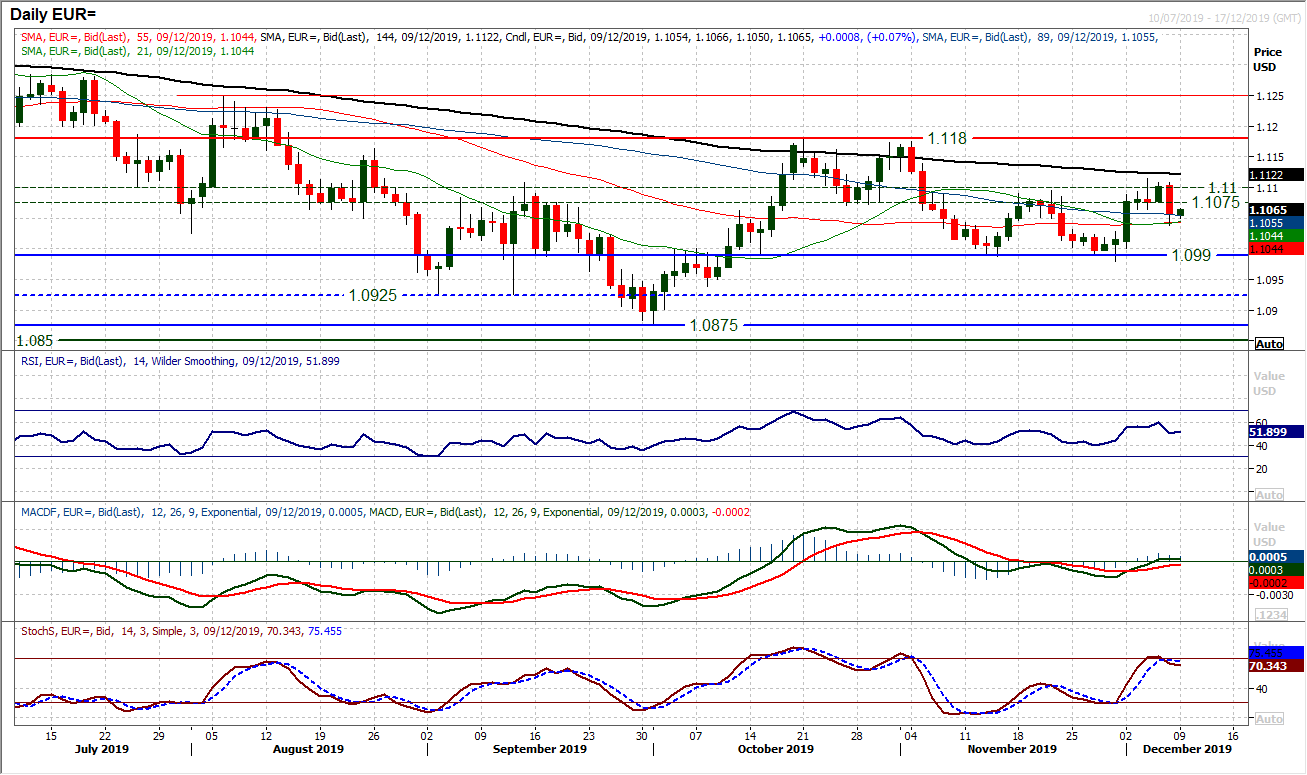
With the strong payrolls report a bearish engulfing candlestick pattern changes the near term outlook again. Closing at a four session low means that the euro bulls are again under pressure within what has become a two month trading range between $1.0990/$1.1180. We have talked about a pivot band $1.1075/$1.1100 being a decent near to medium term gauge and trading below this edges a slightly corrective outlook again. The momentum indicators are neutrally configured with the RSI and MACD lines moderating around their neutral points, whilst the Stochastics have turned over to suggest the recent rebound has run its course. We looked at $1.1065 as a near term support last week and this has now been breached to become a basis of resistance initially today. However, the dollar strength seems to have been relatively short-lived from the payrolls report and whilst $1.1040 support is intact then the range lows between $1.0980/$1.1100 will be protected.
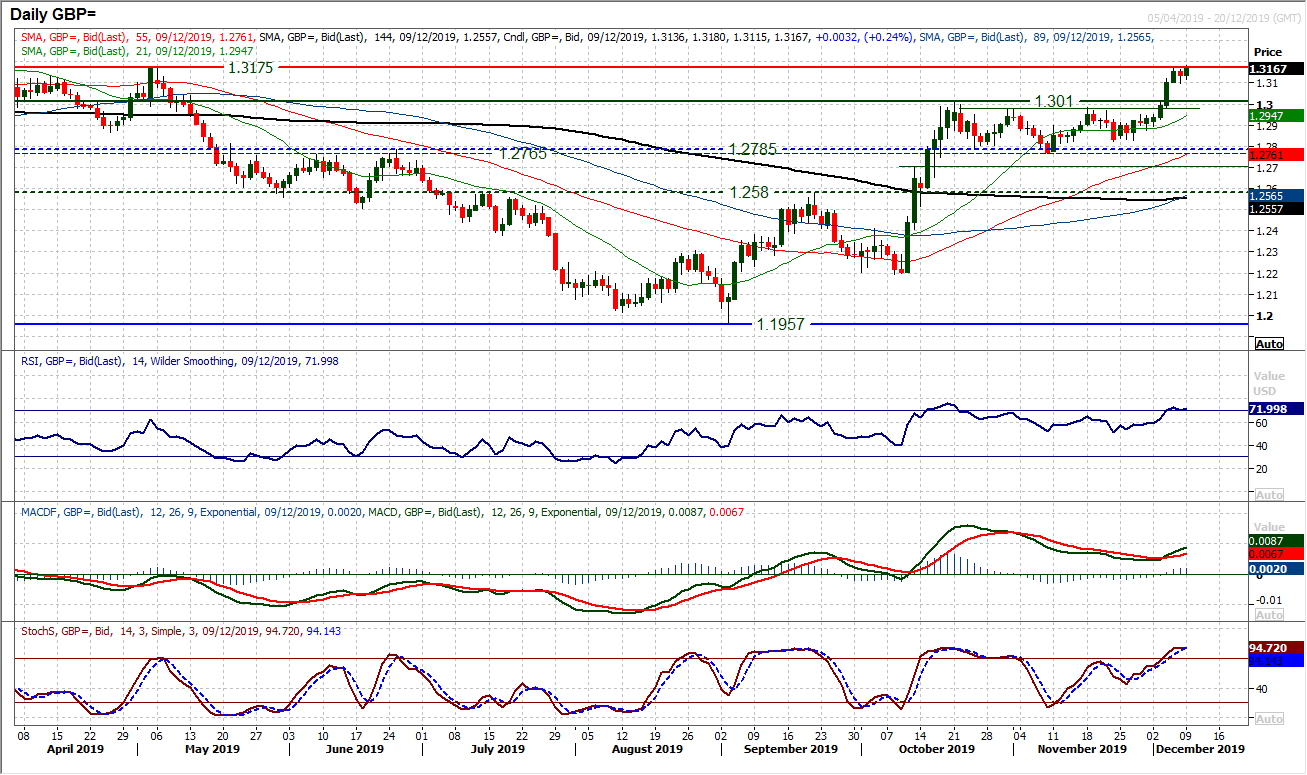
As we edge closer to the UK General Election (on Thursday 12th December) and the opinion polls continue to consistently suggest a Conservatives majority, traders are taking a view. From a strategy view, we are looking towards $1.3500 area in Q1 2020 on a solid Conservative majority (40+ seat majority). A slight wobble to the recent run higher on Friday never really took too much profit-taking as the view seems to be strengthening. Another move higher today is adding to this. Initial resistance of the old May high of $1.3175 is being tested this morning, but the key resistance is $1.3383 from March. Given the strength of momentum (RSI solid in 70s, MACD lines turning higher with upside potential and Stochastics strong), intraday weakness is a chance to buy. This seems to be the market now taking a view. Barring some sort of late Boris Johnson calamity, Cable seems to be set now for gains.
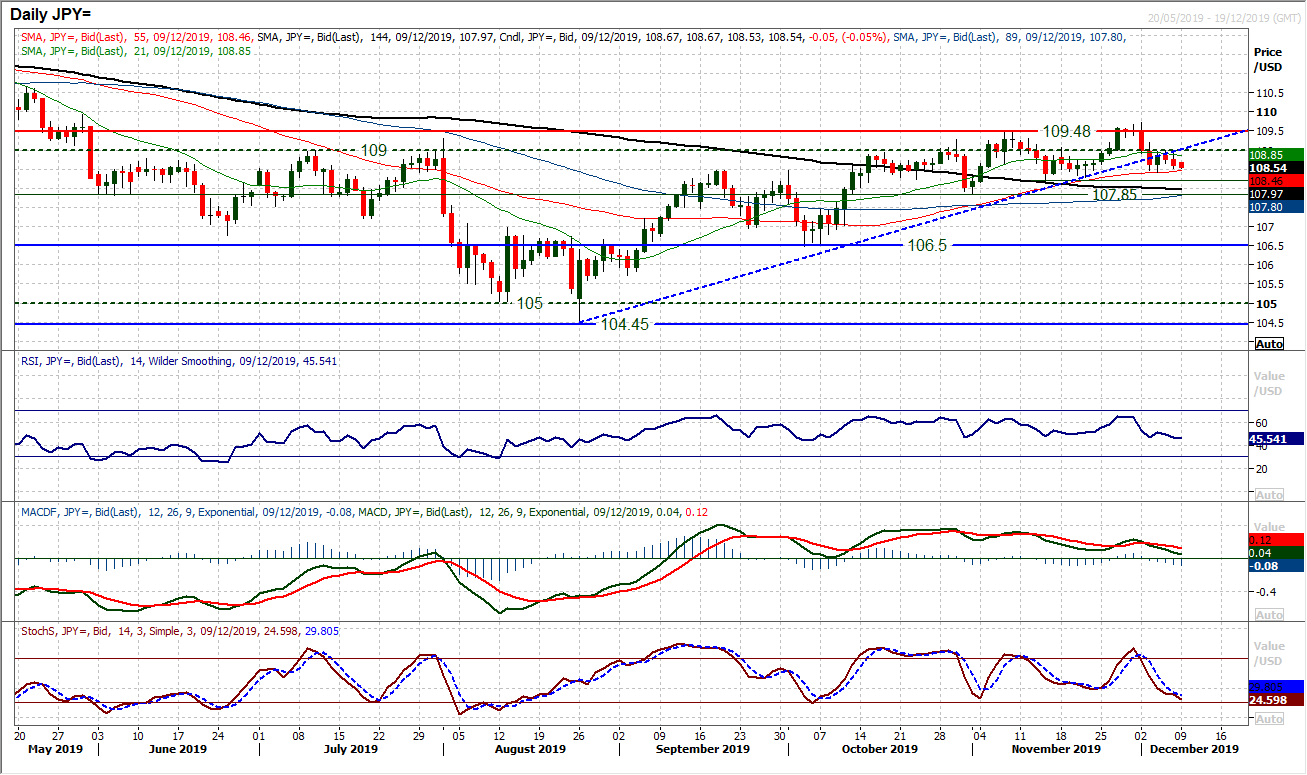
The US dollar bulls were unable to hold traction from the strong payrolls report or Michigan Sentiment on Friday. Another failure under the old 109.00 level will add to concerns that are growing about the lack of conviction that the bulls now have. They would have hoped to have quickly regained the initiative following the latest breach of a 14 week uptrend early last week. However, posting a somewhat negative candlestick after such positive looking US data reflects the loss of control for the bulls. The trade dispute remains a far greater impact on the near to medium term outlook on Dollar/Yen, but for now there is a lack of conviction. The support at 108.25 remains a very important higher low and whilst this is intact, there is still a positive outlook. However, the negative candles are racking up now and this is weighing on momentum. The bulls need to be careful as a breach of 108.25 in conjunction with RSI below 45 and MACD lines below neutral would be a key clutch of corrective signals.
Gold
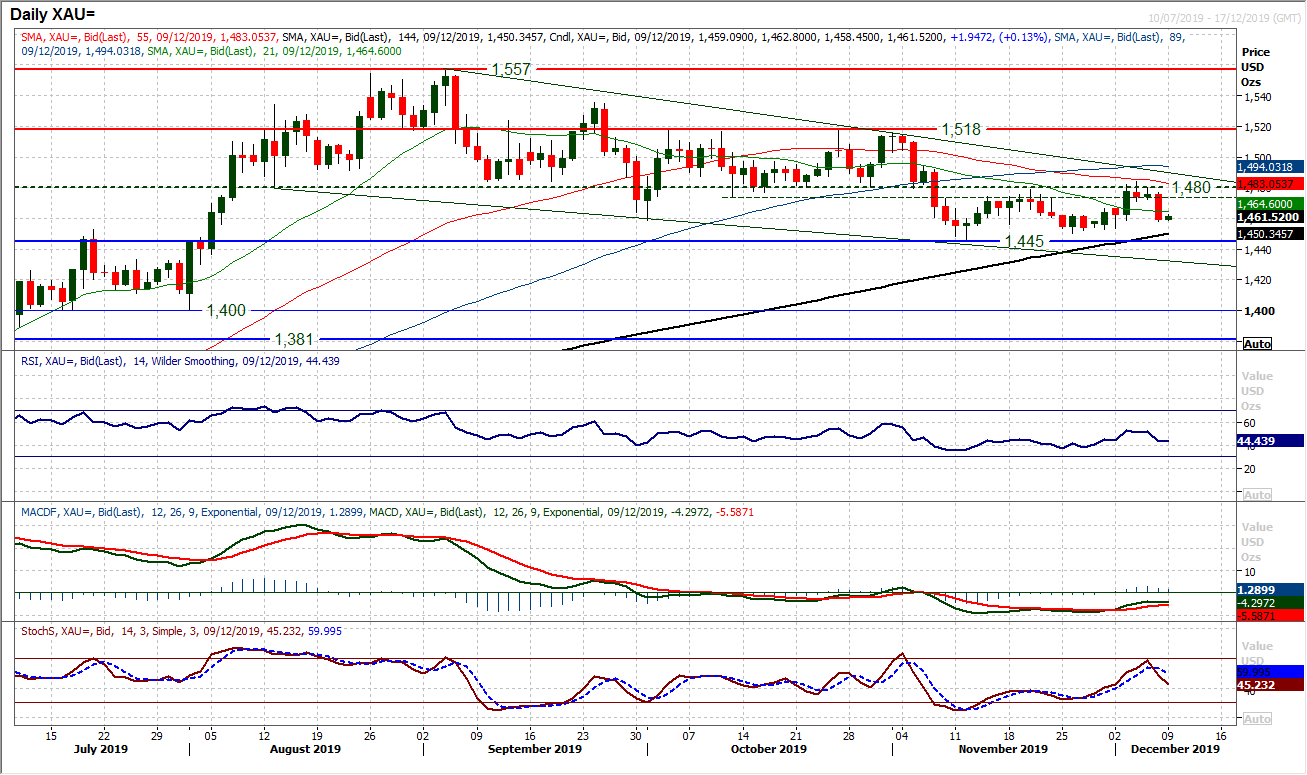
The resistance band of the overhead supply at $1480 has weighed on Gold in recent weeks. Once more it has been bolstered as a resistance by Friday’s decisive negative candle. The risk positive/dollar positive implications of the payrolls data has pulled the market lower once more. It looks as though gold is now in a new phase of ranging between $1445/$1484. We have previously (at length) discussed our view that there was a medium term negative outlook. This outlook has wavered in recent weeks as the selling pressure has failed to sustain enough to drag the market for the next bear leg lower. Equally though the bulls have failed to generate recovery, and one failed attempt to breakout above $1480 aside, there has been consistent resistance found around the overhead supply of the old August to October lows. Whilst the selling pressure again this morning seems to have dissipated, we must wait for pressure on $1445. However, all technical signals continue to point lower and towards using rallies as a chance to sell. The hourly chart shows resistance $1466/$1471.
WTI Oil
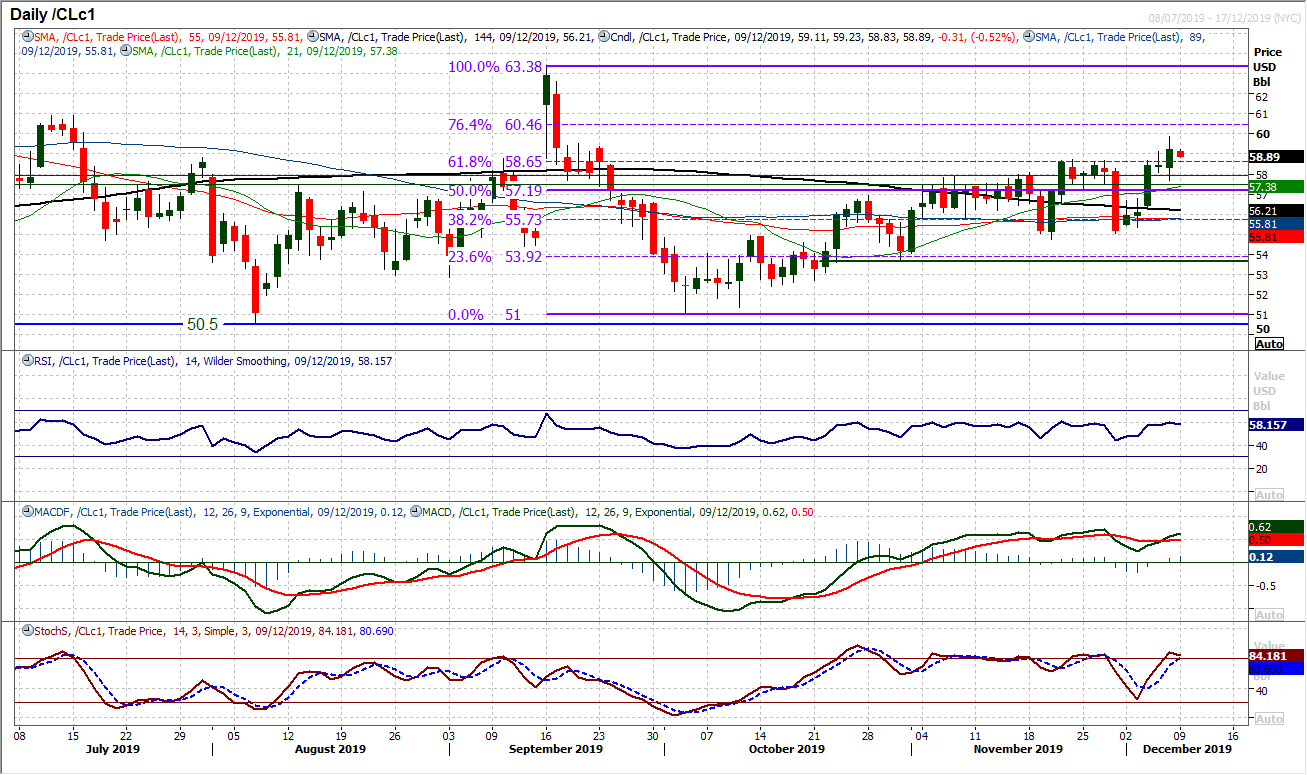
After some uncertainty through the OPEC meetings, WTI has broken out again. A solid positive candle on Friday closed the market at its highest since 17th September and the bulls are looking more confident. The key will now be how they react to the move. In previous breakouts over recent months, the bulls have quickly had the reins tugged. Pullbacks have been supported, but chasing breakouts have historically not been the best timing. With the RSI still under 60 whilst MACD and Stochastics hover around areas where previous rallies have faltered, this needs to be a breakout treated with due caution. There is a higher low support of Friday’s low at $57.70 which inside the $57.20/$58.00 support band. So this band is a key gauge for the strength of the bulls now. The 76.4% Fib retracement (of $63.40/$51.00) at $60.45 is the next upside target above Friday’s high of $59.85.
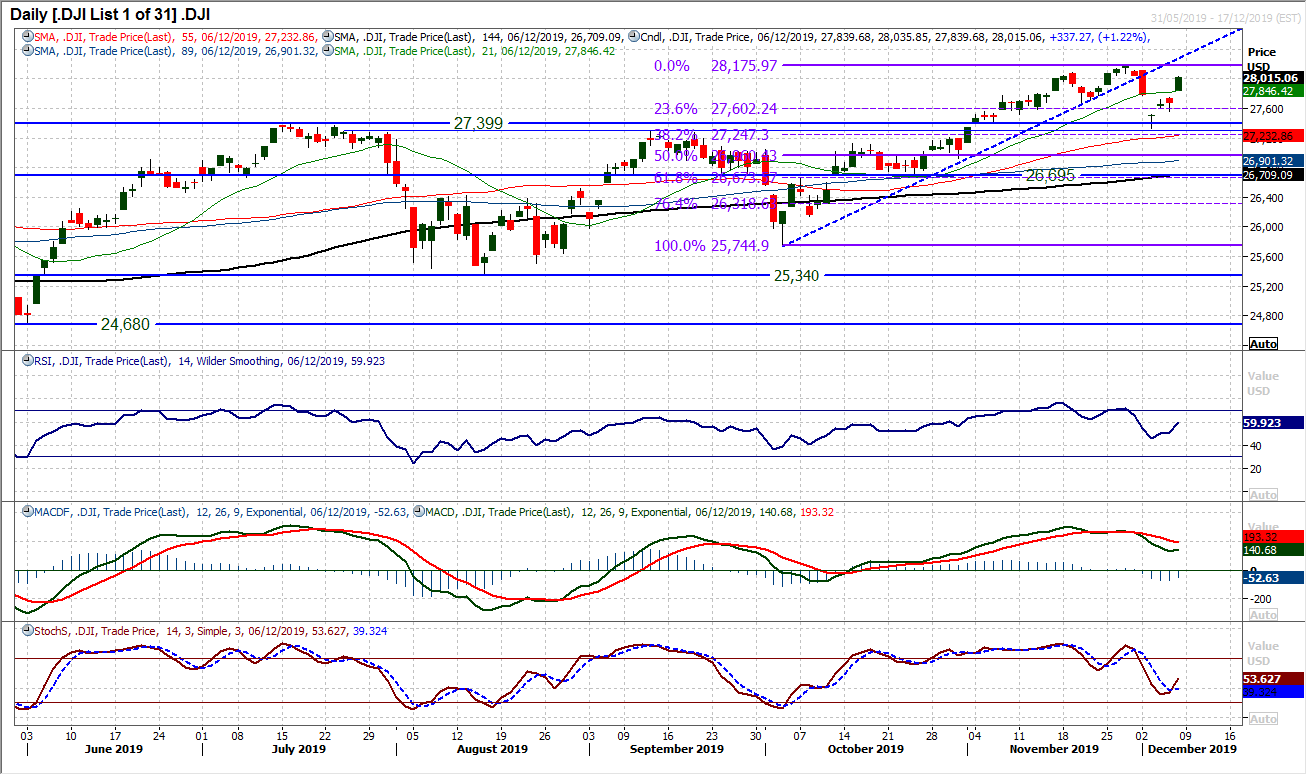
It is almost a gap per day on the Dow at the moment. After a period of uncertainty, Friday’s blowout jobs report has sent the Dow sharply higher again. The solid and decisive bull candle has once more opened the door to the all-time highs again. With an Average True Range of 203 ticks, the November high of 28,175 is easily again back within range of another positive session. Momentum indicators are pulling forward once more, with a bull cross on Stochastics, MACD lines bottoming out above neutral and RSI above 50. Near term weakness looks to be a chance to buy again. Initial support is at 27,840 with the gap at 27,745.
DISCLAIMER: This report does not constitute personal investment advice, nor does it take into account the individual financial circumstances or objectives of the clients who receive it. All information and research produced by Hantec Markets is intended to be general in nature; it does not constitute a recommendation or offer for the purchase or sale of any financial instrument, nor should it be construed as such.
All of the views or suggestions within this report are those solely and exclusively of the author, and accurately reflect his personal views about any and all of the subject instruments and are presented to the best of the author’s knowledge. Any person relying on this report to undertake trading does so entirely at his/her own risk and Hantec Markets does not accept any liability.
As we move to within one week of the next potentially key milestone in the trade dispute, traders have started Monday’s session on a somewhat cautious note. The unambiguously strong Nonfarm Payrolls report from Friday has quickly lost impetus and the focus is quickly turning back to trade again. According to Donald Trump’s economic adviser, Larry Kudlow, the prospect of further tariffs being implemented on 15th December remains live.
Those traders that monitor USD/CNY as a gauge for developments in the trade dispute will note that the rate has ticked back higher again this morning and remains above 7.00. The latest trade data out of China brings into focus the impact that the dispute is having. China Trade Balance saw the surplus narrow to +$38.7bn in November (+$46.3bn exp, +$42.8bn in October). This came with Chinese exports missing estimates with a fourth consecutive month of decline -1.1% in November (1.0% exp, -0.9% October), although a slight positive came as Chinese imports grew by +0.3% (-1.8% exp, -6.4% October). A cautious reaction is being seen across major markets. Treasury yields have come back from Friday’s highs and on forex, the yen is strengthening again. Equity traders are looking edgy again. However, there is a trade with a one track mind at the moment though, with sterling back on track for strength.
The UK election looms and the Conservatives have a sizeable lead in the polls. This is considered to be positive for pushing the Brexit process forward. A seven month high for cable and two year and seven months highs for sterling against the euro.
Wall Street closed strongly higher on Friday with the S&P 500 +0.9% at 3146, whilst US futures are more cautious today, currently -1 tick lower. The broad cautious sentiment means that Asian markets have been unable to take too much strength, with the Nikkei +0.3% and Shanghai Composite +0.1%. I
n Europe, this is translating to a mild slip back on DAX Futures -0.1%, whilst FTSE futures are taking the added impact of sterling strength and are -0.2% early today.
In forex, caution is weighing marginally on AUD and NZD whilst USD is stuttering. The big outperformer is GBP which is +0.4% versus the dollar.
In commodities, the moves are helping gold find a degree of support with +$2, whilst oil is just off the top from Friday’s gains post OPEC+.
The economic calendar is thin on the ground today. Only really the Eurozone Sentix Investor Confidence for December at 09:30 GMT which is expected to slip back to -4.9 (from -4.5 in November).
Chart of the Day – Silver
Silver and gold tend to still have fairly similar outlooks, so Silver’s downside break on Friday of the November low at $16.62 will be of concern for the gold bulls. A move to a new four month low comes with the continued trend lower of recent months. Lower highs and lower lows are gradually dragging silver back. Momentum indicators are now consistently correctively configured and rallies are seen as a chance to sell. The RSI is consistently failing around 50 and back under 40, whilst the MACD lines are struggling under neutral and turning lower again, as Stochastics have now crosses back lower. The latest failure early this week around $17.30 and a band of overhead supply has come with a decisive move lower in recent sessions. This suggests that coming into the new week, that near term rallies remain a struggle for positive traction. The hourly chart shows resistance around $16.75/$16.85 now and is a near term sell zone. The falling 21 day moving average is also a decent gauge and is falling today at $16.94. The next support is $15.88.

With the strong payrolls report a bearish engulfing candlestick pattern changes the near term outlook again. Closing at a four session low means that the euro bulls are again under pressure within what has become a two month trading range between $1.0990/$1.1180. We have talked about a pivot band $1.1075/$1.1100 being a decent near to medium term gauge and trading below this edges a slightly corrective outlook again. The momentum indicators are neutrally configured with the RSI and MACD lines moderating around their neutral points, whilst the Stochastics have turned over to suggest the recent rebound has run its course. We looked at $1.1065 as a near term support last week and this has now been breached to become a basis of resistance initially today. However, the dollar strength seems to have been relatively short-lived from the payrolls report and whilst $1.1040 support is intact then the range lows between $1.0980/$1.1100 will be protected.

As we edge closer to the UK General Election (on Thursday 12th December) and the opinion polls continue to consistently suggest a Conservatives majority, traders are taking a view. From a strategy view, we are looking towards $1.3500 area in Q1 2020 on a solid Conservative majority (40+ seat majority). A slight wobble to the recent run higher on Friday never really took too much profit-taking as the view seems to be strengthening. Another move higher today is adding to this. Initial resistance of the old May high of $1.3175 is being tested this morning, but the key resistance is $1.3383 from March. Given the strength of momentum (RSI solid in 70s, MACD lines turning higher with upside potential and Stochastics strong), intraday weakness is a chance to buy. This seems to be the market now taking a view. Barring some sort of late Boris Johnson calamity, Cable seems to be set now for gains.


The US dollar bulls were unable to hold traction from the strong payrolls report or Michigan Sentiment on Friday. Another failure under the old 109.00 level will add to concerns that are growing about the lack of conviction that the bulls now have. They would have hoped to have quickly regained the initiative following the latest breach of a 14 week uptrend early last week. However, posting a somewhat negative candlestick after such positive looking US data reflects the loss of control for the bulls. The trade dispute remains a far greater impact on the near to medium term outlook on Dollar/Yen, but for now there is a lack of conviction. The support at 108.25 remains a very important higher low and whilst this is intact, there is still a positive outlook. However, the negative candles are racking up now and this is weighing on momentum. The bulls need to be careful as a breach of 108.25 in conjunction with RSI below 45 and MACD lines below neutral would be a key clutch of corrective signals.
Gold
The resistance band of the overhead supply at $1480 has weighed on Gold in recent weeks. Once more it has been bolstered as a resistance by Friday’s decisive negative candle. The risk positive/dollar positive implications of the payrolls data has pulled the market lower once more. It looks as though gold is now in a new phase of ranging between $1445/$1484. We have previously (at length) discussed our view that there was a medium term negative outlook. This outlook has wavered in recent weeks as the selling pressure has failed to sustain enough to drag the market for the next bear leg lower. Equally though the bulls have failed to generate recovery, and one failed attempt to breakout above $1480 aside, there has been consistent resistance found around the overhead supply of the old August to October lows. Whilst the selling pressure again this morning seems to have dissipated, we must wait for pressure on $1445. However, all technical signals continue to point lower and towards using rallies as a chance to sell. The hourly chart shows resistance $1466/$1471.

WTI Oil
After some uncertainty through the OPEC meetings, WTI has broken out again. A solid positive candle on Friday closed the market at its highest since 17th September and the bulls are looking more confident. The key will now be how they react to the move. In previous breakouts over recent months, the bulls have quickly had the reins tugged. Pullbacks have been supported, but chasing breakouts have historically not been the best timing. With the RSI still under 60 whilst MACD and Stochastics hover around areas where previous rallies have faltered, this needs to be a breakout treated with due caution. There is a higher low support of Friday’s low at $57.70 which inside the $57.20/$58.00 support band. So this band is a key gauge for the strength of the bulls now. The 76.4% Fib retracement (of $63.40/$51.00) at $60.45 is the next upside target above Friday’s high of $59.85.

It is almost a gap per day on the Dow at the moment. After a period of uncertainty, Friday’s blowout jobs report has sent the Dow sharply higher again. The solid and decisive bull candle has once more opened the door to the all-time highs again. With an Average True Range of 203 ticks, the November high of 28,175 is easily again back within range of another positive session. Momentum indicators are pulling forward once more, with a bull cross on Stochastics, MACD lines bottoming out above neutral and RSI above 50. Near term weakness looks to be a chance to buy again. Initial support is at 27,840 with the gap at 27,745.

DISCLAIMER: This report does not constitute personal investment advice, nor does it take into account the individual financial circumstances or objectives of the clients who receive it. All information and research produced by Hantec Markets is intended to be general in nature; it does not constitute a recommendation or offer for the purchase or sale of any financial instrument, nor should it be construed as such.
All of the views or suggestions within this report are those solely and exclusively of the author, and accurately reflect his personal views about any and all of the subject instruments and are presented to the best of the author’s knowledge. Any person relying on this report to undertake trading does so entirely at his/her own risk and Hantec Markets does not accept any liability.
