All indications point to how US consumers have been spending their stimulus checks in recent weeks.
According to the numbers released by the Census Bureau, retail and food services sales increased 9.8% in March from the previous month and 27.7% year-over-year (YoY).
Meanwhile, data released Apr. 22 showed fewer Americans filed for initial unemployment claims last week. Finally, in March, the Conference Board's Consumer Confidence Index also beat expectations, increasing to 109.7 from 90.4 in February. The next set of data is due at the end of April.
And spending is good for the economy.
Congressional Research Service (CRS), a federal legislative branch agency located within the Library of Congress, highlights:
"Consumer spending is a key driver of short-run economic growth in the U.S. economy.... Consumer confidence due to economic conditions may increase purchases of durable goods (goods that can be used over a long period of time), such as vehicles or major appliances."
Therefore, today we introduce two exchange-traded funds (ETFs) that might appeal to readers who believe US consumers could be willing and able to spend even more in the coming months.
1. Fidelity MSCI Consumer Discretionary Index ETF
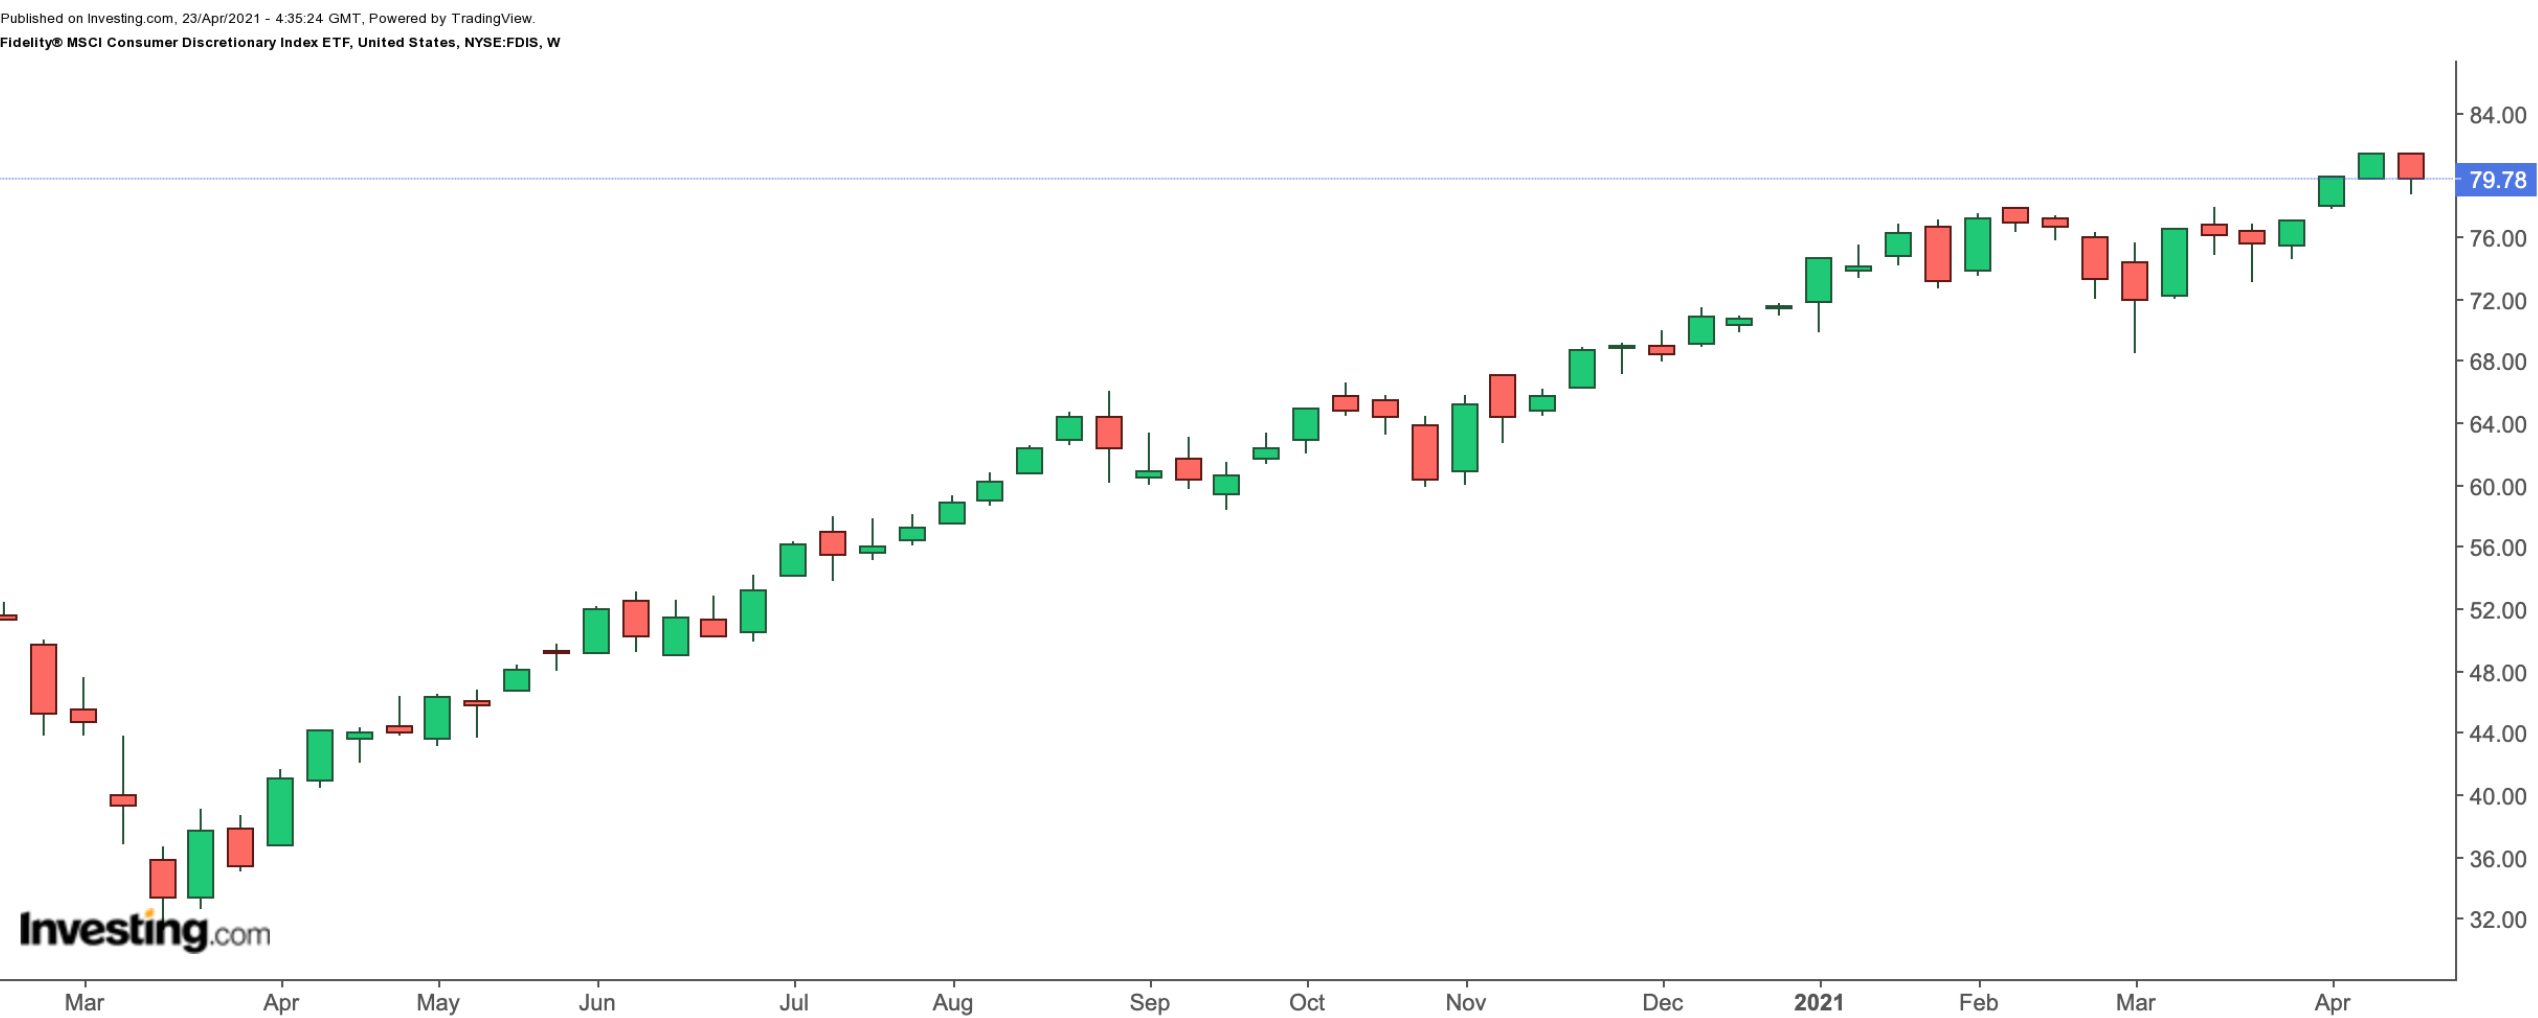
Current Price: $79.78
52-Week Range: $43.13 - $81.44
Dividend Yield: 0.58%
Expense Ratio: 0.58% per year
The Fidelity® MSCI Consumer Discretionary Index ETF (NYSE:FDIS) invests mainly in US businesses that offer non-essential products and services. When household budgets are not constrained, individuals tend to spend more on discretionary items. We can divide discretionary goods into manufactured items (like automotive, household durable goods, textiles and leisure equipment) and services (like hotels, restaurants, cinemas and retailers).

The fund started trading in October 2013, and net assets are about $1.5 billion. FDIS, which has 275 holdings, tracks the returns of the MSCI USA IMI Consumer Discretionary Index. The current sectoral breakdown looks like this: internet and direct marketing retail (25.34%), specialty retail (20.35%), hotels, restaurants and leisure (18.12%), automobiles (12.45%), textiles, apparel and luxury goods (6.76%), household durables (5.15%), and others.
The top 10 companies account for about 55% of the fund. Amazon (NASDAQ:AMZN), Tesla (NASDAQ:TSLA), Home Depot (NYSE:HD), McDonald’s (NYSE:MCD), Nike (NYSE:NKE) and Lowe’s (NYSE:LOW) are among the leading names. Readers should note that the weighting of AMZN and TSLA stocks is 21.28% and 9.60%, respectively. Thus, a large move in either company’s share price could significantly affect this top-heavy fund.
Since the start of the year, FDIS has returned 12.5%. The fund also hit a record high in recent days. Trailing P/E and P/B ratios are 33.15 and 6.91, respectively. The current earnings season could quickly put pressure on some of the names in the fund. Interested readers would find a better value between $75 - $80.
2. SPDR S&P Retail ETF
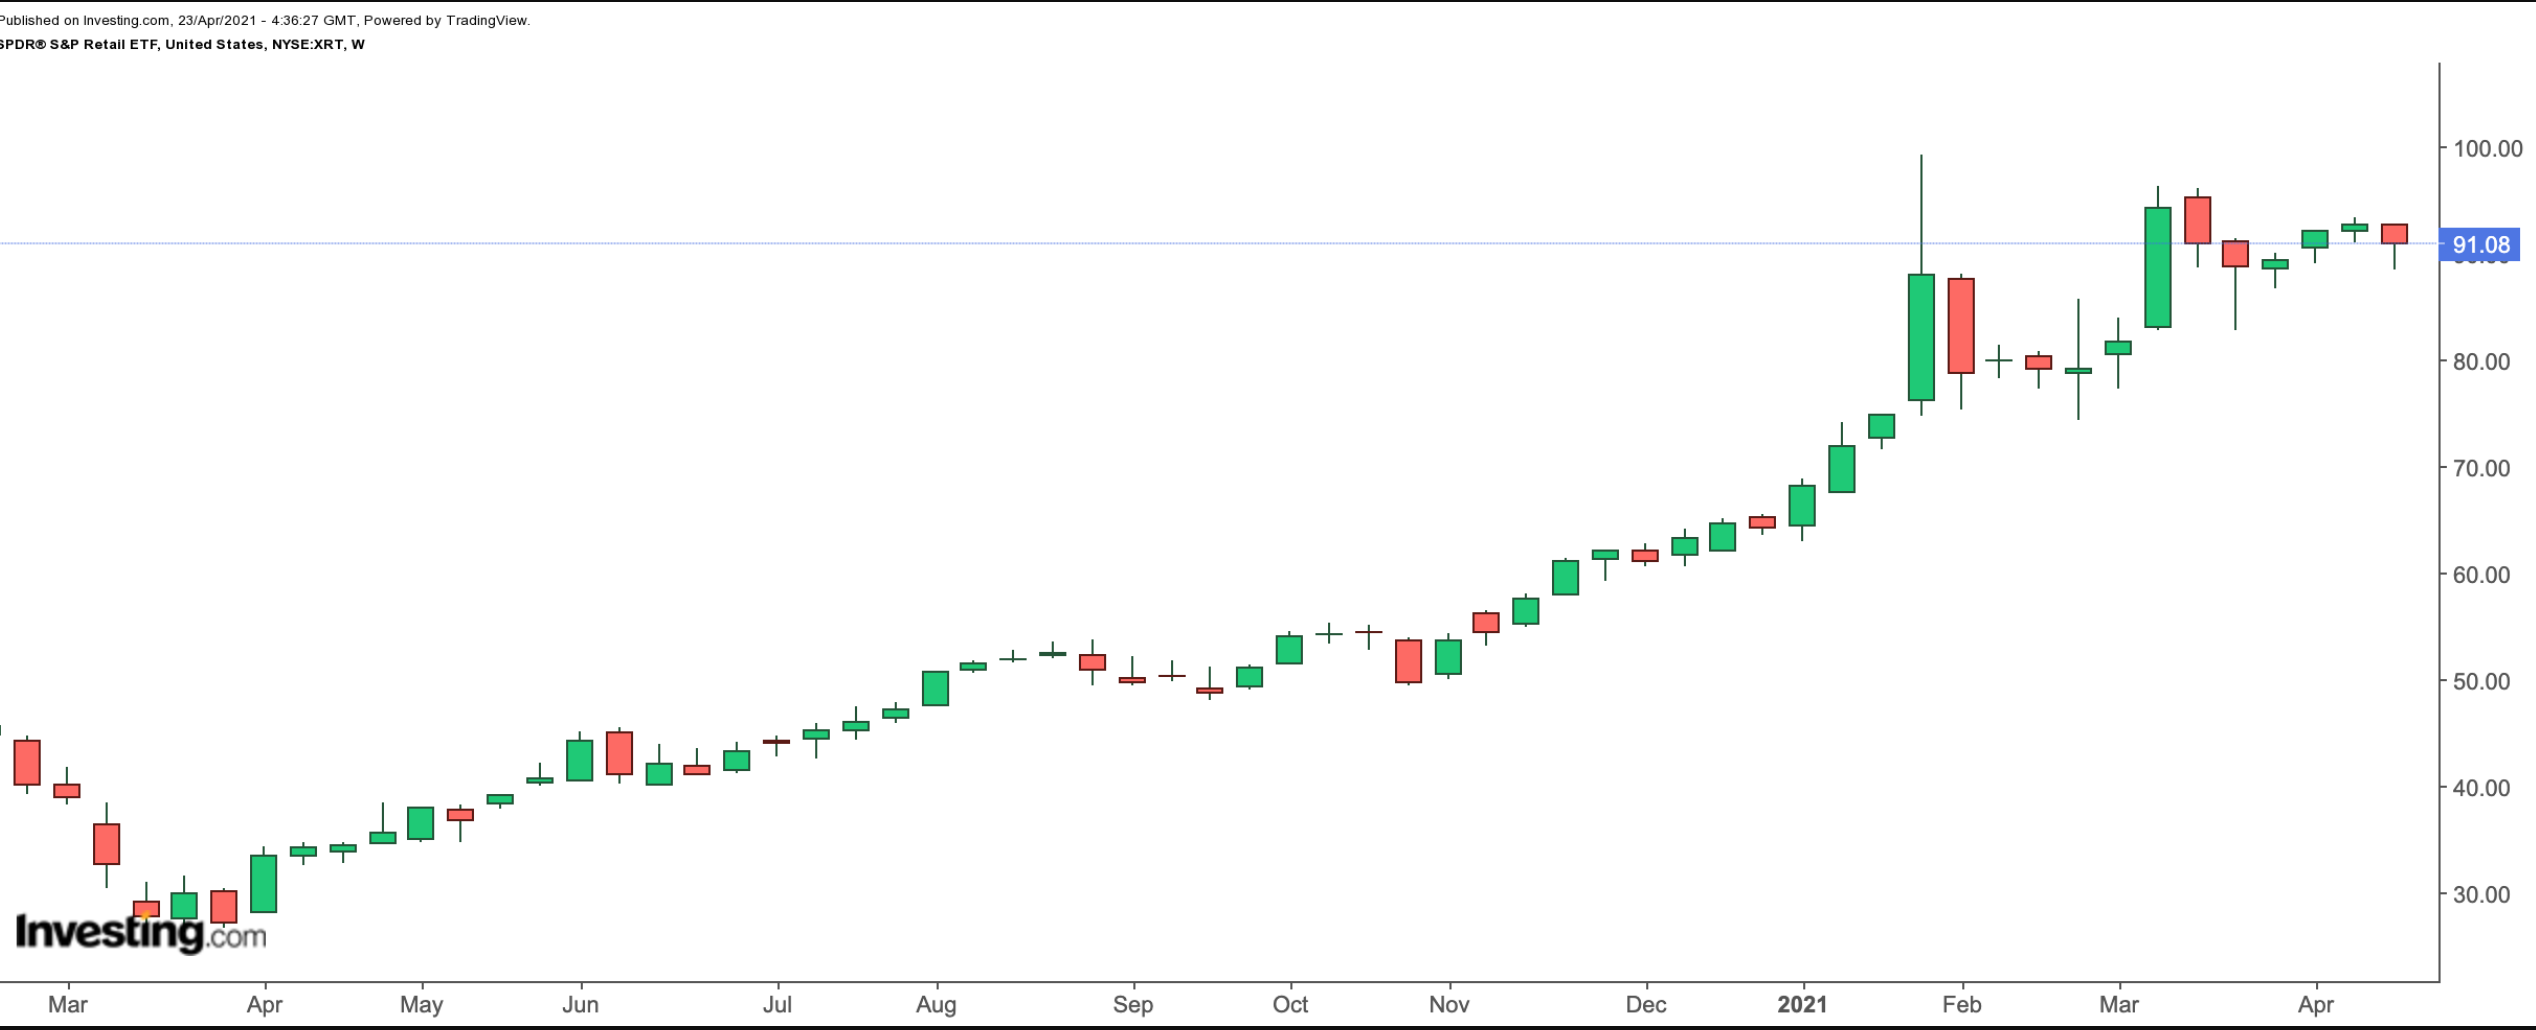
Current Price: $91.08
52-Week Range: $33.16 - $99.24
Dividend Yield: 0.88%
Expense Ratio: 0.35% per year
The SPDR® S&P Retail ETF (NYSE:XRT) provides access to a range of retail businesses. Since its inception in June 2006, net assets have grown to $656 million.

XRT, which has 101 holdings, tracks the S&P Retail Select Industry Index. The top 10 names comprise about 12.5% of assets. Thus, price moves in a single stock cannot significantly influence the value of the fund. In terms of sub-sectors, internet and direct marketing retail businesses have the largest weighting, with 20.58%. Next in line are apparel retail (19.53%), automotive retail (18.88%), specialty stores (15.66%) and food retail (6.62%).
Among the leading businesses are multi-brand specialty retailer American Eagle Outfitters (NYSE:AEO), sporting goods and outdoor recreation retailer Academy Sports Outdoors (NASDAQ:ASO), automotive parts retailer AutoZone (NYSE:AZO), omni-channel retailer Target (NYSE:TGT) and online vehicle sales platform Vroom (NASDAQ:VRM).
Year-to-date, XRT has climbed by 42% and hit an all-time high in late January. Trailing P/E and P/B ratios stand at 18.99 and 3.91, respectively. In the case of profit-taking in the coming weeks, we'd look to invest in the fund between $85 - $90. Most of the names in the fund are likely to continue creating shareholder value for many quarters to come.
