Market Overview
Donald Trump had the stage to lay out the path towards this “phase one” agreement between the US and China that has so dominated market sentiment in recent weeks. Instead of talking about when a signing event could take place, where and over what, he used yesterday’s speech as an opportunity to make a thinly veiled critique suggesting that China were “cheaters” in world trade. Although negotiators are close to an agreement, this was not the risk positive speech the market had been expecting and is a bit of a reality check which reminds the market of how the President operates (in case it had forgotten). It has also engendering what seems to be a building caution across major market again. Bond yields have fluctuated, but it is interesting to see other safe havens gaining ground. The Japanese yen performance is picking up, as is that of the Swiss franc. There has even been a rebound on gold starting to emerge. Furthermore, equities are looking for corrective today. If this is the case, are the bull trends on equity markets set to come under pressure? The one ray of light for the bulls has been the Reserve Bank of New Zealand which surprised pretty much everyone in standing pat on rates today (-25bps cut expected to +0.75%, +1.00% last). Apparently, previous moves to cut rates have left current monetary policy as appropriate. This has driven a big jump in the Kiwi dollar today.
Wall Street closed mixed last night with the S&P 500 +0.2% at 3092 last night, but US futures are giving this all back today, currently -0.2%. Asian markets have the implications of the Hong Kong civil unrest to add to their woes, closing weaker across the board with the Nikkei -0.9% and Shanghai Composite -0.3%. In Europe, the outlook is being dragged lower, with FTSE futures -0.5% and DAX futures -0.4%. In forex, a mixed look to majors, with lack of real direction for USD but the clear front runner being NZD which is over 1% higher today. In commodities, the risk averse outlook is coming through, with a mild rebound on gold whilst oil is slipping back by half a percent.
There is a big emphasis on inflation for the economic calendar today. UK CPI is at 0930GMT which is expected to see headline CPI slip to +1.6% in October (from +1.7% in September) whilst core CPI is expected to remain at +1.7% (+1.7% in September). US CPI is at 1330GMT and is expected to show little change with headline CPI expected to be +1.7% in October (+1.7% in September) whilst core CPI is expected to be +2.4% in October (+2.4% in September). The first day of Fed Chair Powell’s testimony to Congress comes with the Joint Economic Committee in the Senate at 1500GMT. Powell’s written testimony is followed by a series of questions.
Chart of the Day – EUR/CHF
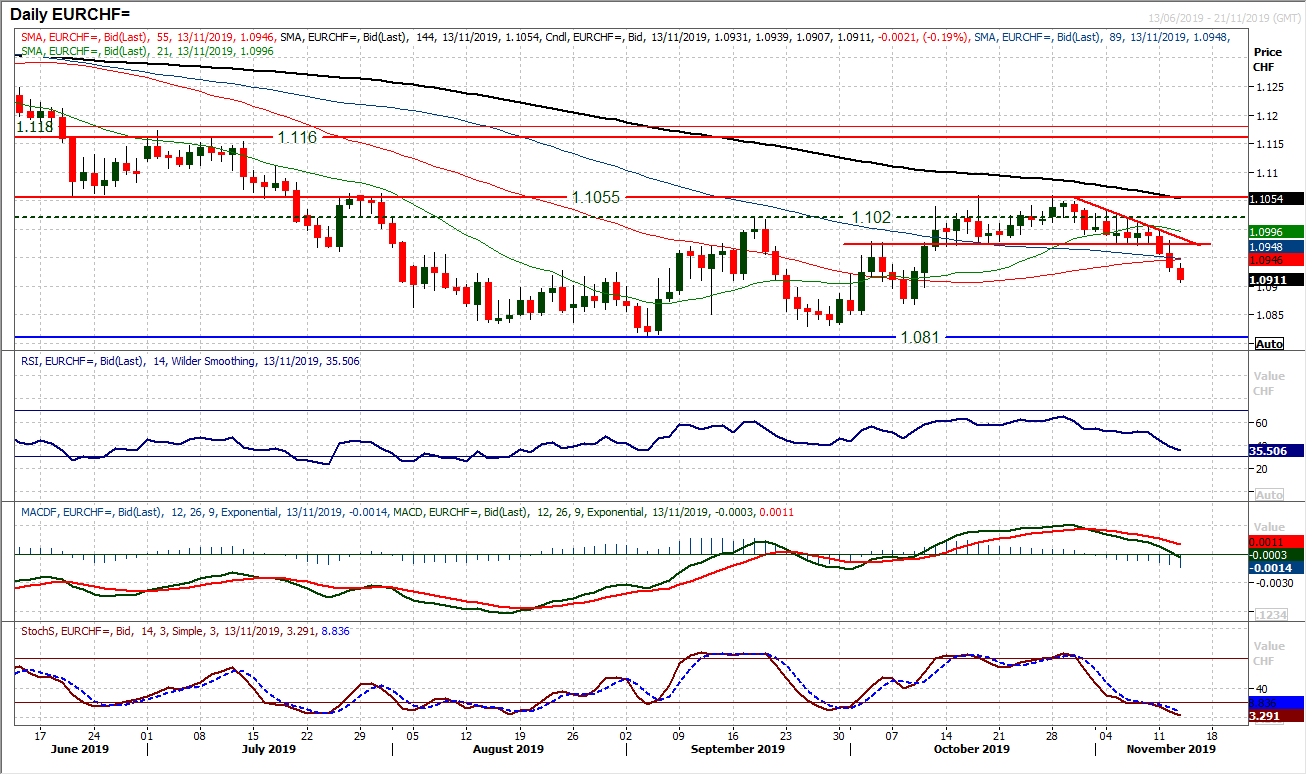
There has been a shift back towards more risk averse currencies in the major crosses. This is leading to renewed deterioration in the outlook for Euro/Swiss. The market failed to build on the breakout above the September high and now corrective momentum is growing. Struggling under the old 1.1020 level throughout last week, another old October pivot level at 1.0970 has now seen two closing breaches in the past two sessions. Coming with increasingly negative configuration on Stochastics, corrective MACD and falling RSI, the outlook is of lower highs and lower lows and a continued deterioration back towards testing the lows 1.0810/1.0865 is growing more likely. The RSI breaking under 40 confirms this. There is now an intraday sell zone around 1.0970/1.0995, whilst the hourly chart shows any unwind around 50/60 on RSI lends renewed downside potential.
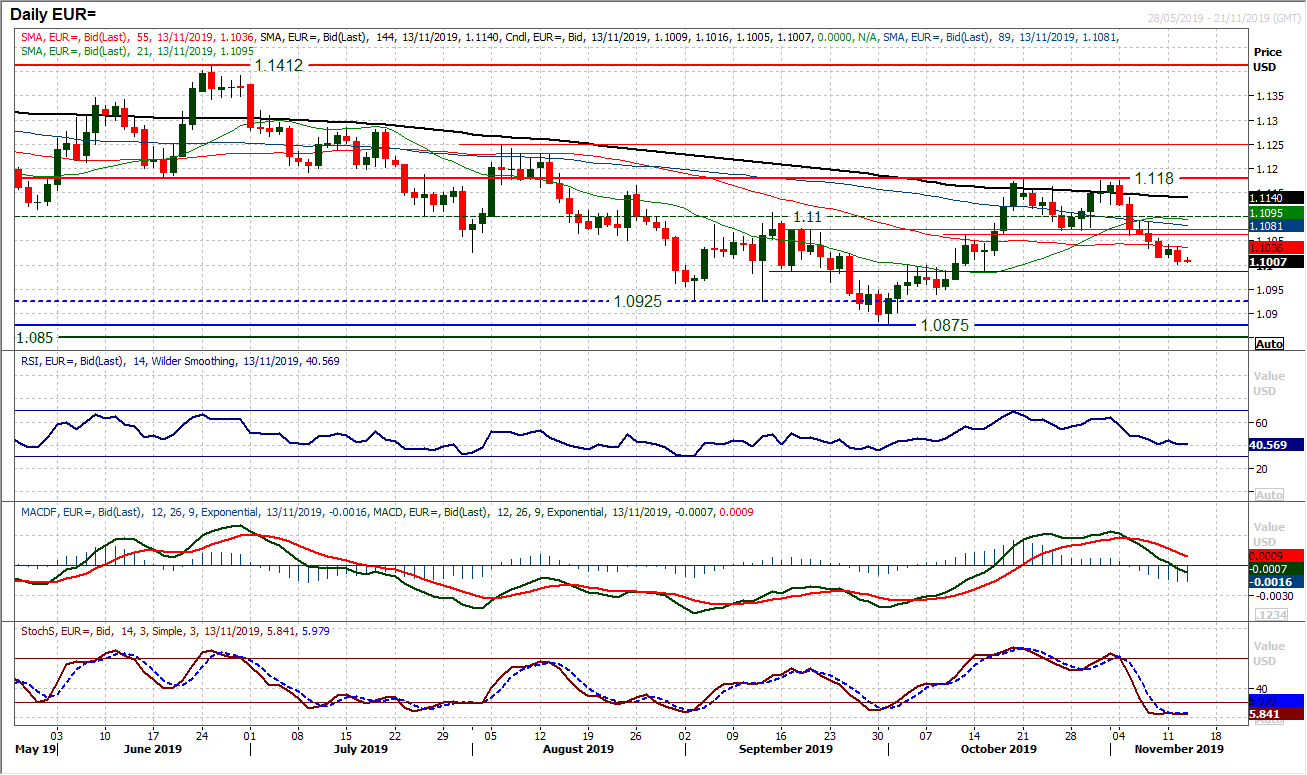
With the dollar bulls regaining control, another negative daily candlestick on EUR/USD is dragging the market to the brink of another key test. The psychological $1.1000 held into the close last night but $1.0990 was a mid-October low and as an old pivot is the next real support. Momentum remains on a path of deterioration and whilst not quite bearish yet, they are teetering on the brink. MACD lines are falling close to moving below neutral, whilst RSI is hovering around 40. If these two levels are broken, along with a move below $1.0990 it would signal the next phase of selling. This would then open a likely full retreat towards $1.0875/$1.0925. The bulls will be aware of the run of lower daily highs that needs to be broken, with the latest failure around $1.1040 yesterday. The hourly chart reflects the negative bias with hourly RSI failing consistently under 60 and pushing 30, whilst hourly MACD lines fail unde neutral. A change to this is needed for bulls to be hopeful.
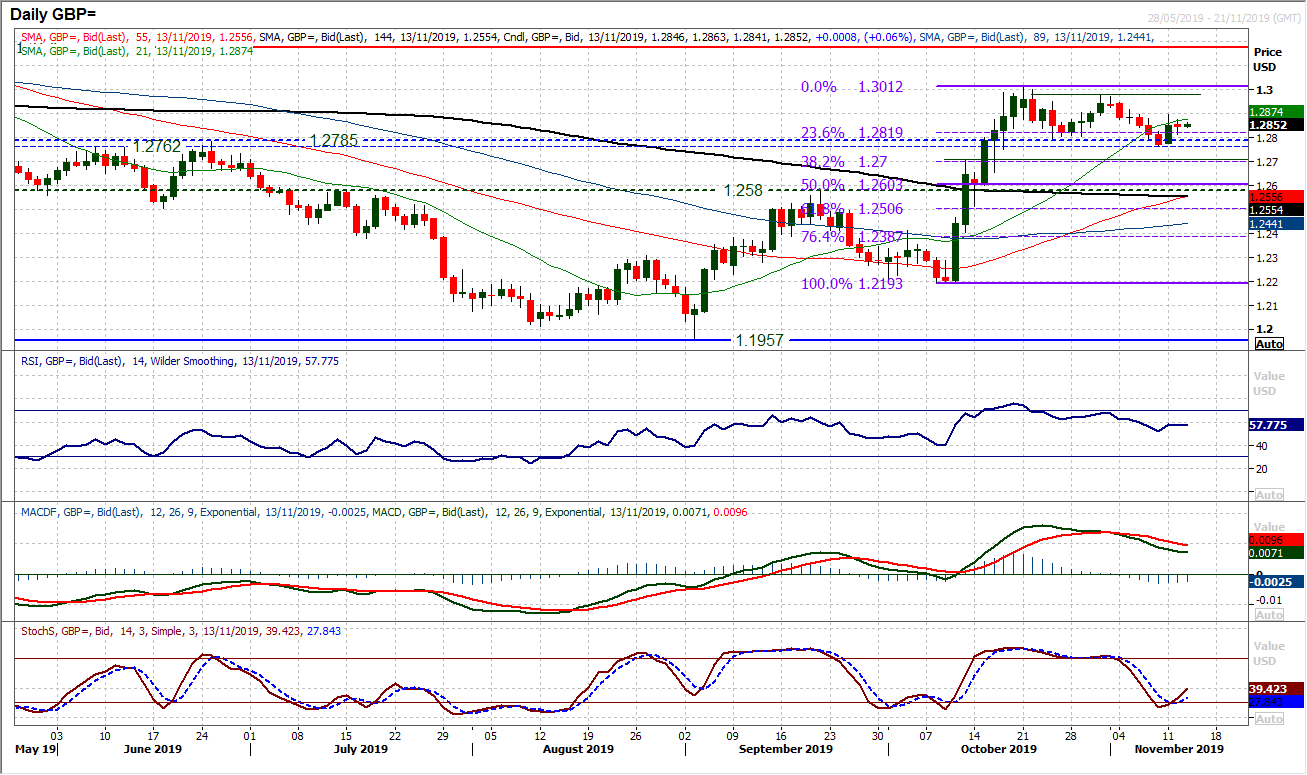
The momentum in the sterling rally has faltered. Monday’s bull candle petered out at $1.2900 intraday and the market has since been drifting. We continue to see Cable as a mild corrective drift in the days and weeks leading up to the UK General Election. Opinion polls will cause spikes but essentially rallies will fade and a net drift lower will ensue. Momentum indicators reflect this as the RSI builds lower highs and lower lows along with the market recently. MACD lines are also similar. This points towards pressure back towards $1.2760/$1.2785 support band and the 23.6% Fib (of the $1.2193/$1.3012 rally) at $1.2820. Initial resistance today at $1.2875 and support comes in at $1.2815.
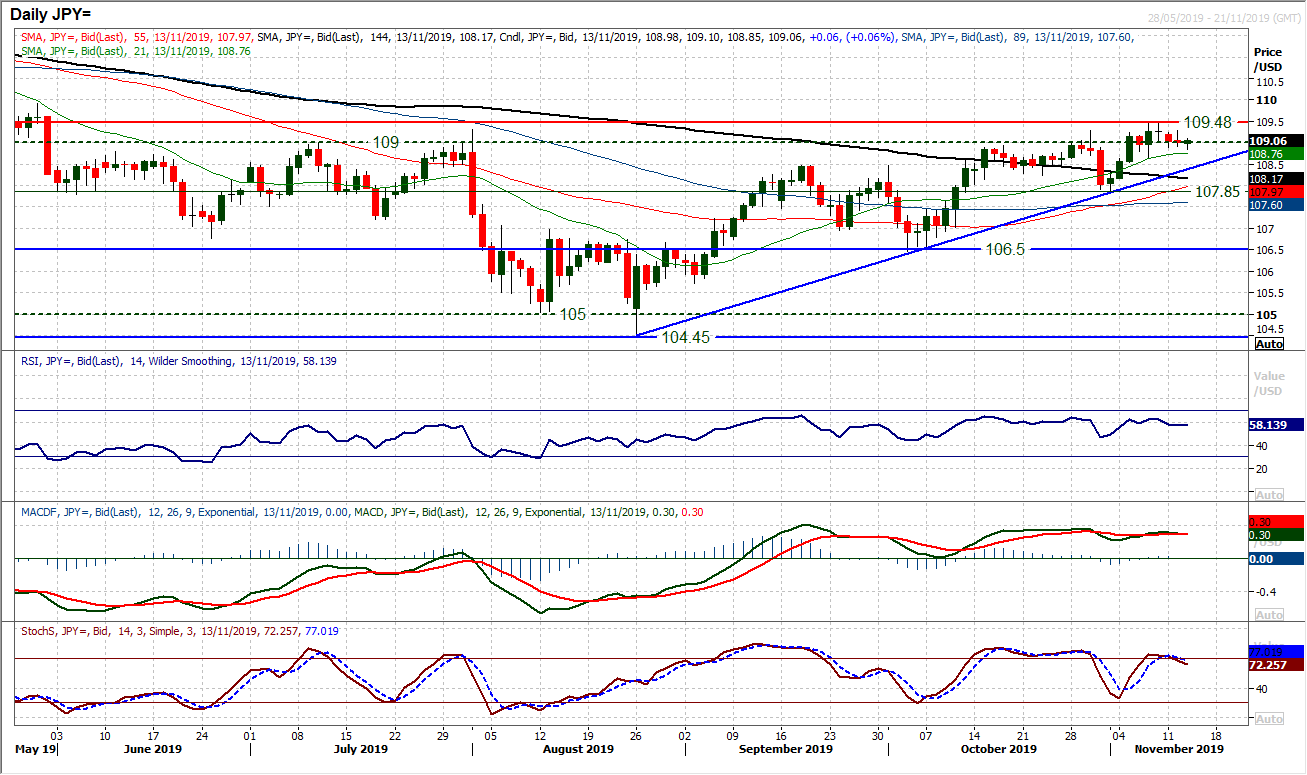
There is still a positive outlook whilst the pair trades above 109.00 and near term corrections remain a chance to buy. However, taking a step back suggests that momentum is not as strong as it should be with a breakout to multi-month highs that has been seen. The outlook is positive without being overtly bullish. The 11 week uptrend around 108.40 underpins the move higher and whilst the 108.65 support is intact there will still be bull control. However, if the market continues to fail under 109.50 (last week’s high) the bulls may be beginning to tire. A close above 109.50 is needed to open 109.90 and the May high at 110.65 as the next real test, and if comes with RSI into the high 60s it would be a key confirmation. However, for now, given the rather drab candles of recent sessions, focus is more on a consolidation around the 109.00 breakout and defending 108.65 as initial support. With the Average True range around 50 pips and multi- month lows, this is a market consolidation. Have the bulls got the energy to decisively breakout?
Gold
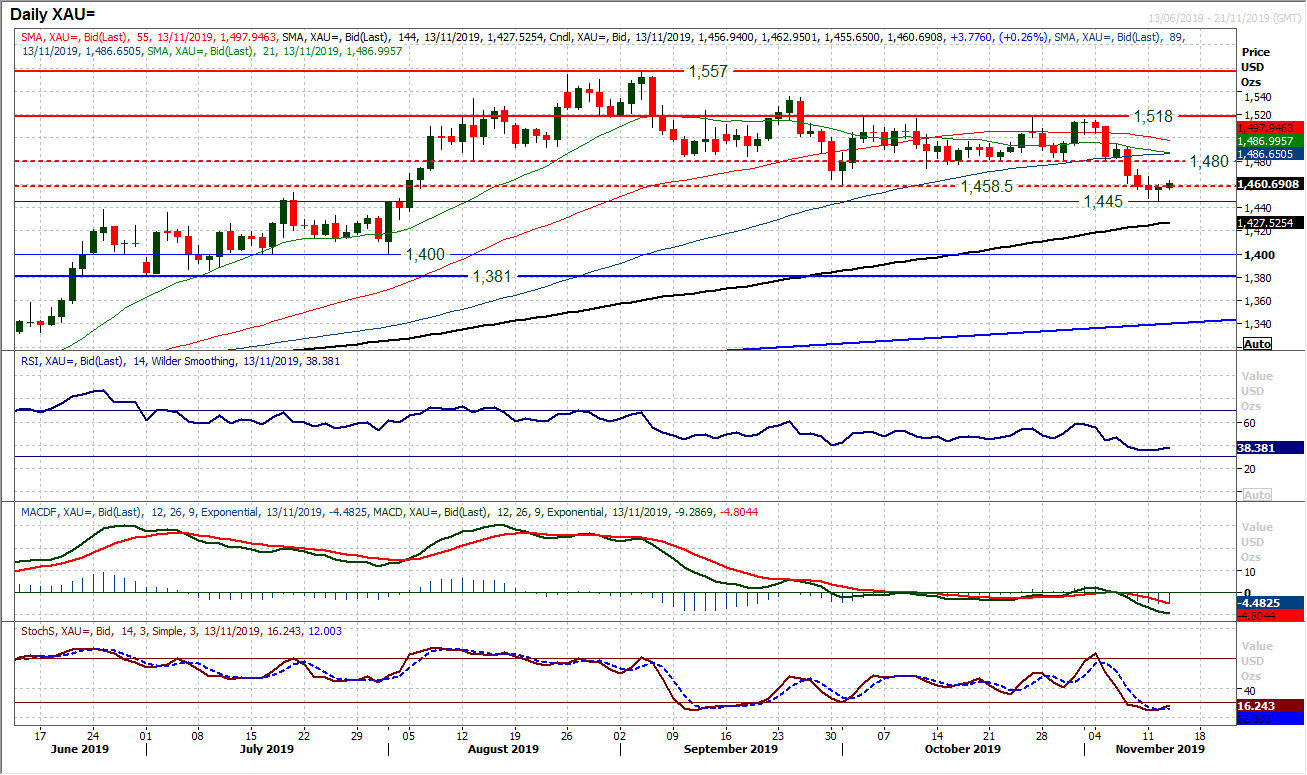
Time for a near term pullback rally? A small bull hammer one day candlestick pattern has swung the market higher. A close back above $1458 today would add to this recovery potential, however, we would view this as just a near term move. This is likely to simply be a rally that helps to renew downside potential. With the market breaking support at $1474/$1480 and subsequently $1458 this week this has been a key trend changing move. We now see rallies into resistance as a chance to sell. The hourly chart shows improved near term momentum and above $1458 implies a rebound into the low $1470s. However, the move to such a more negative momentum configuration really suggests that sentiment has shifted on gold for now. A deeper correction is developing and we would view $1474/$1480 as an area where the sellers will look for opportunities again.
WTI Oil
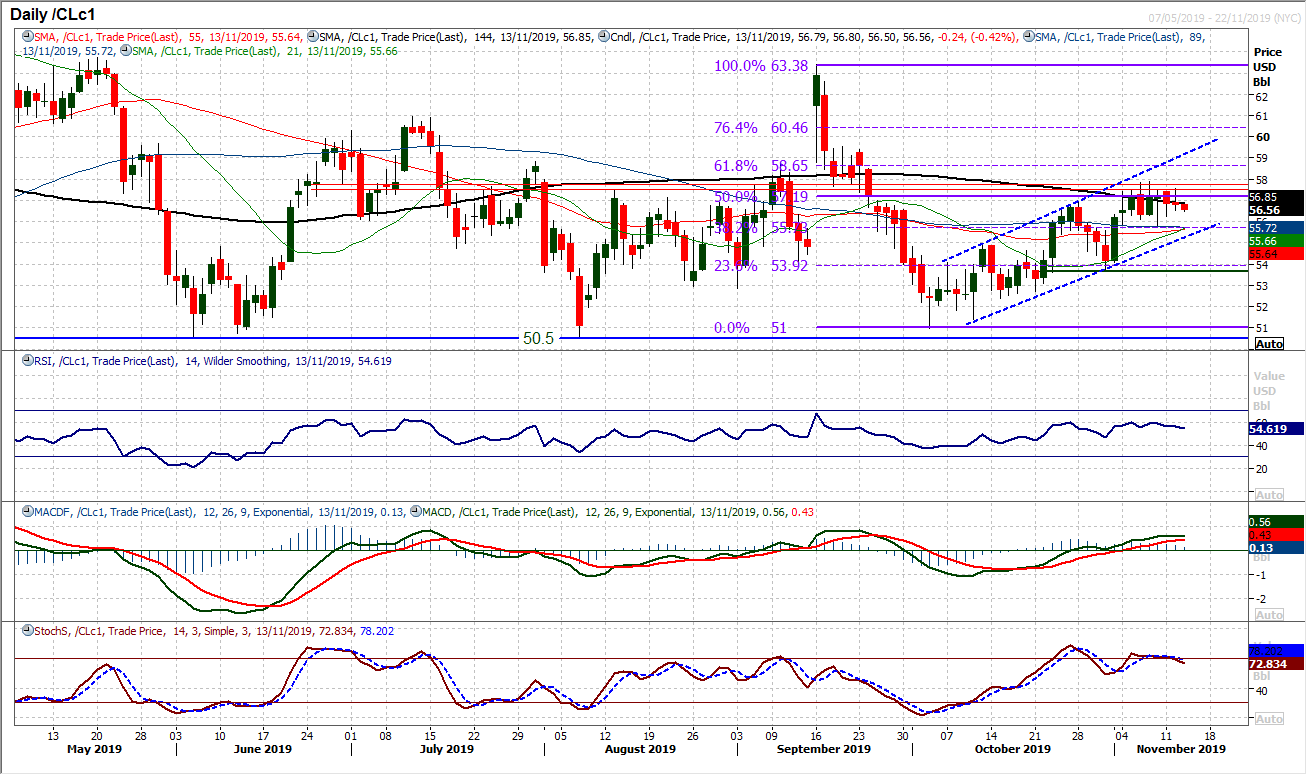
The consolidation of the past week and a half continues, but just in the past couple of sessions a mild positive bias is petering away. The past seven sessions have all traded around the 50% Fib level (of the $63.40/$51.00 sell-off) at $57.20. However, yesterday’s slip into the close and today’s early weakness is just pulling the market lower again. This brings the support at $55.75 initial support and the trend channel support (at $55.25 today) into view again. Momentum indicators are just beginning to edge lower (reflective of the recent move in price) but still within the scope of a positive medium term recovery of the trend channel. We would still view near term weakness as a chance to buy for another test of the resistance at the 50% Fib at $57.20 and last week’s highs of $57.85.
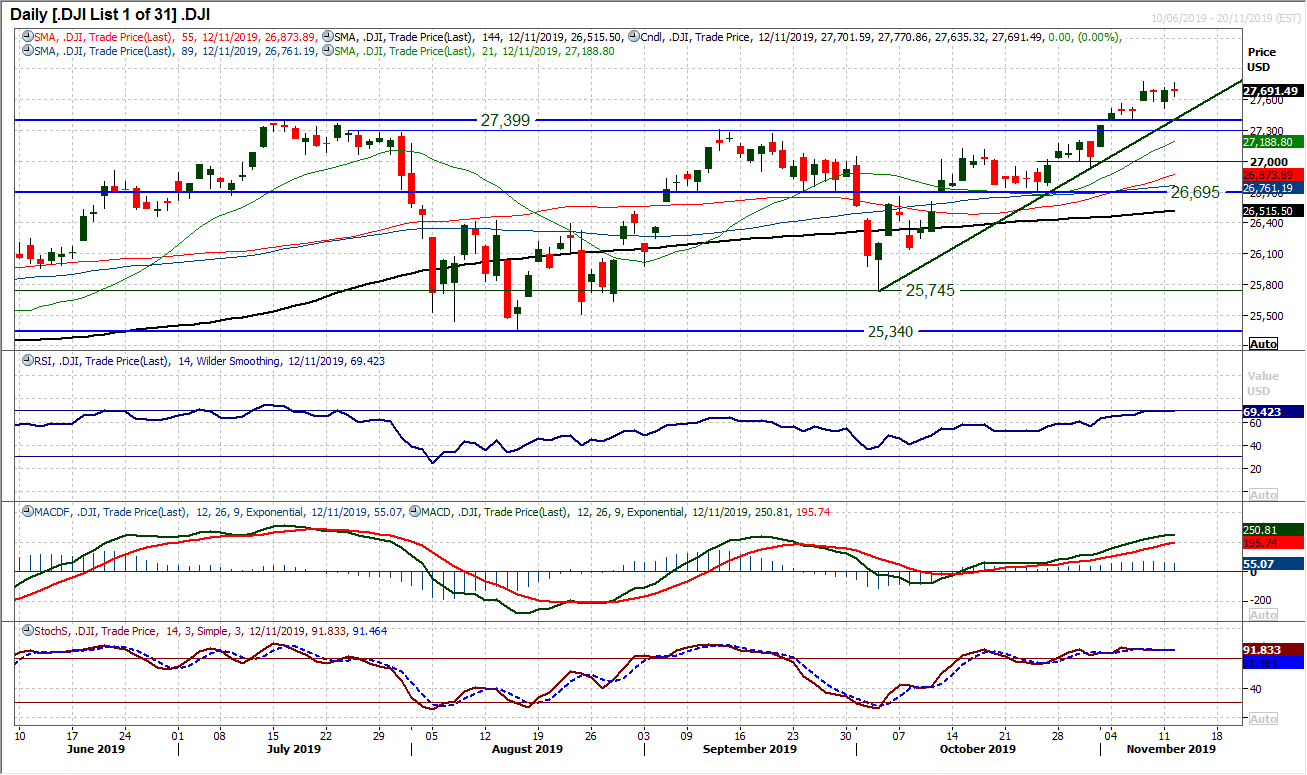
An incredibly rare event happened yesterday. The Dow closed absolutely dead flat on the session. A second (almost) doji candle in three sessions suggests there is a degree of caution beginning to creep into the market, although the bulls remain in control. The uptrend of the past five weeks now rises at 27,408 and is above the key breakout support 27,307/27,399. Momentum indicators remain positively configured, if arguably a little stretched with the RSI around the 70 mark and Stochastics flattening off. However, with the recent trend intact we see any unwinding move as a chance to buy still. It is interesting that the market has not made an all time intraday high for the past three sessions (with 27,775 still a barrier) and it will be interesting to see how the market would respond to losing near term support at 27,518. The key test would be the key breakout band 27,307/27,399. For now though we are happy to trade with the trend.
"""DISCLAIMER: This report does not constitute personal investment advice, nor does it take into account the individual financial circumstances or objectives of the clients who receive it. All information and research produced by Hantec Markets is intended to be general in nature; it does not constitute a recommendation or offer for the purchase or sale of any financial instrument, nor should it be construed as such.
All of the views or suggestions within this report are those solely and exclusively of the author, and accurately reflect his personal views about any and all of the subject instruments and are presented to the best of the author’s knowledge. Any person relying on this report to undertake trading does so entirely at his/her own risk and Hantec Markets does not accept any liability. """
