Wall Street had a stellar comeback since the lows of spring 2020. The Dow Jones Industrial Average, the S&P 500 index, and the NASDAQ 100 index ended the year up by 7.2%, 16.3%, and 47.6%.
Despite the heightened volatility in equities, several industries, stocks, and exchange-traded funds (ETFs) delivered significant returns. These robust moves highlighted the importance of investing for the long-term, without worrying about the markets' daily gyrations.
Meanwhile, for many individuals, a new year also typically means positive resolutions to initiate changes or continue some habits to achieve goals. Therefore, today's article introduces two ETFs that could be appropriate for investors who are resolved to invest regularly for the long-term. An ETF, which typically follows an index, makes it possible for investors to access a basket of businesses (or asset classes) in a given index.
1. Vanguard Total Stock Market ETF
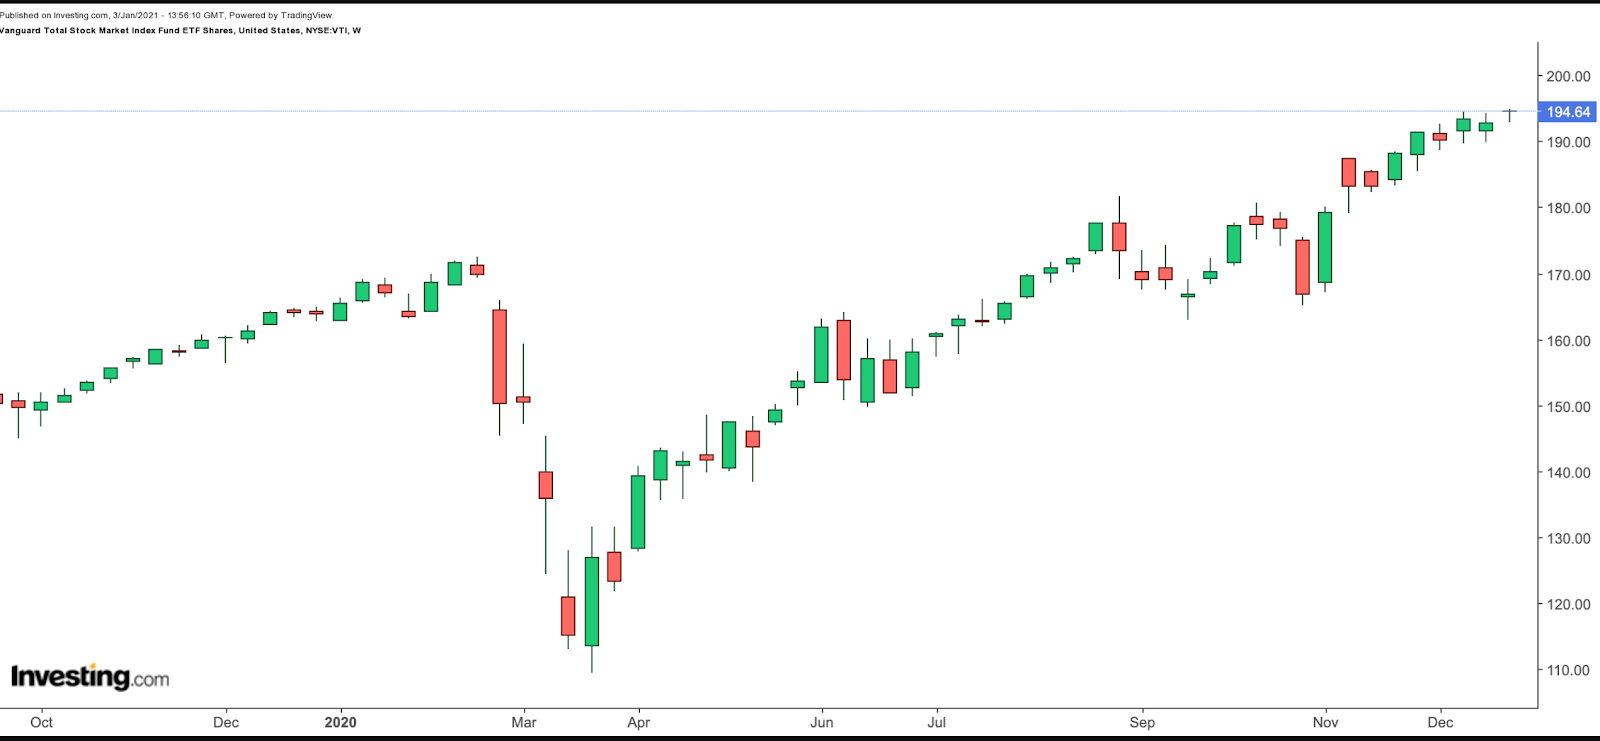
- Current Price: $194.64
- 52-week range: $109.49 - $194.95
- Dividend Yield: 1.42%
- Expense Ratio: 0.03% per year
Legendary investor Warren Buffett believes low-cost 'broad market index funds' could have a place in most retail investors' portfolios. We regard the Vanguard Total Stock Market Index Fund ETF Shares (NYSE:VTI) as one of those ETFs. The fund started trading in May 2001 and its net assets stand at $1.0 trillion.
VTI, which holds 3,556 holdings, tracks the performance of the CRSP US Total Market Index. Therefore, most individual stocks in the fund have little impact on the total price of the ETF, which represents the investible US equity market.
The businesses come from all industries. Their market capitalizations (caps) range from mega to large, mid, and small. As far as industries are concerned, funds are distributed among technology (26.2%), consumer discretionary (16.4%), industrial (13.8%), health care (13.5), financials (10.4%), and others.
23.1% of the assets are in the top ten names. Apple (NASDAQ:AAPL), Microsoft (NASDAQ:MSFT), Amazon (NASDAQ:AMZN), Alphabet (NASDAQ:GOOGL), and Facebook (NASDAQ:FB) head the list of holdings. These businesses need little introduction. Their shares had robust finishes to the year in 2020.
Over the past year, the Vanguard Total Stock Market ETF has returned close to 19%. Its run-up since late October has been notable. The trailing P/E and P/B ratios are 27.7 and 3.6. In other words, the current valuation is on the frothy side from a historical perspective.
In mid-January, the earnings season will kick off, starting with reports from the US banking giants, followed by technology heavyweights. Thus, increased choppiness with a downward bias in share prices could be likely in the coming weeks. Any potential decline that pushes VTI toward $185 might be seen as a better entry point. Investors who are experienced with options might be interested to know that options are available on the fund.
2. Invesco NASDAQ Next Gen 100 ETF
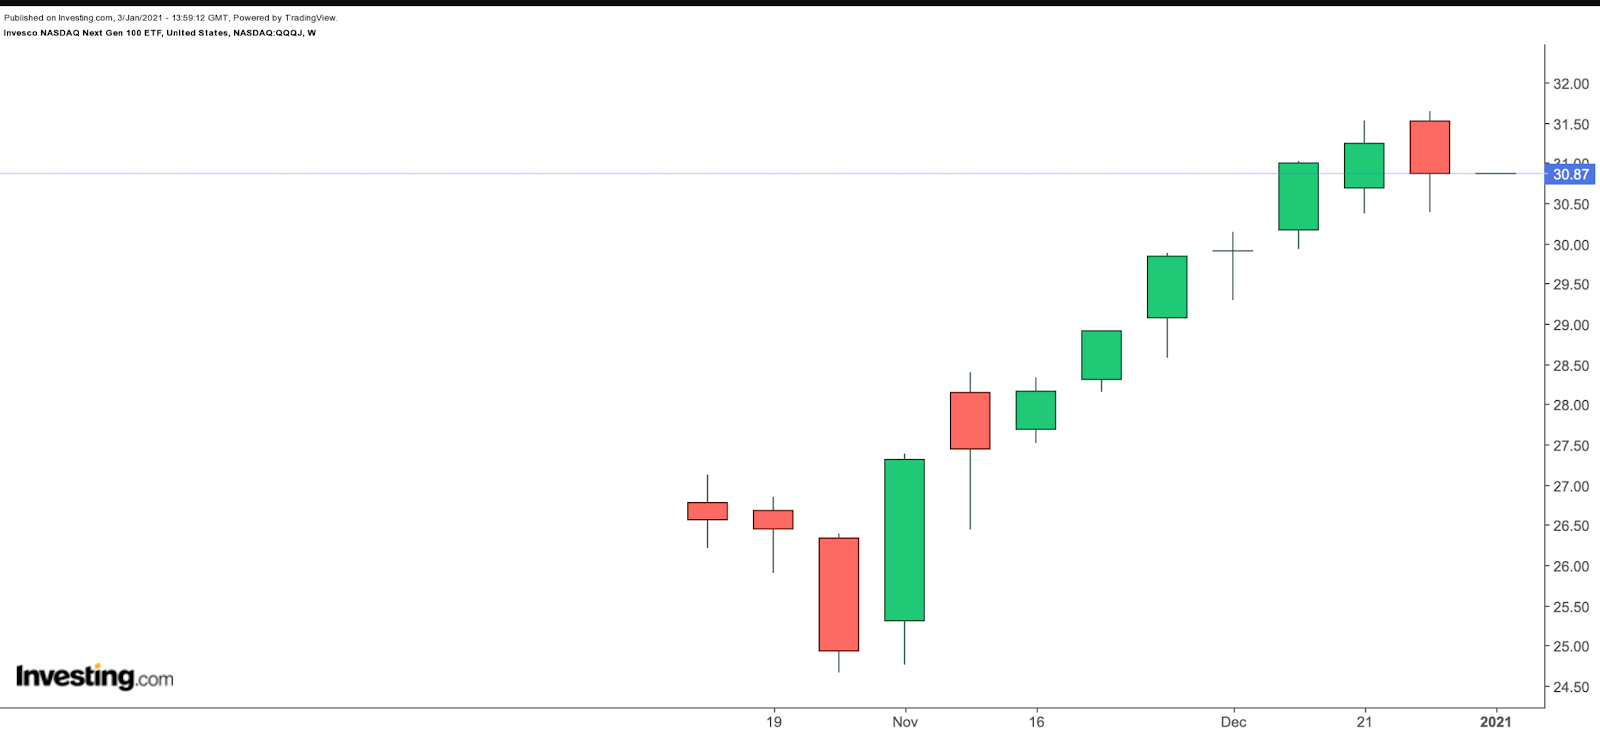
- Current Price: $30.87
- 52 Week Range: $24.67 - $31.65
- Dividend Yield: N/A
- Expense Ratio: 0.15%
Our next fund is the Invesco NASDAQ Next Gen 100 ETF (NASDAQ:QQQJ), which gives access to the 101st to the 200th largest non-financial firms listed on the NASDAQ stock exchange.
Most readers would be familiar with the NASDAQ 100 index that is made up of the 100 largest US and non-US-based non-financial companies listed on the NASDAQ. Many simply refer to NASDAQ 100 as the triple Qs.
The recently-established QQQJ, which tracks the NASDAQ Next Generation 100 index, focuses on firms that could possibly move up to the NASDAQ 100. Assets under management are about $600 million.
Shares of information technology companies have the highest weighting (44.01%), followed by health care (20.17%), communication services (13.59%), consumer discretionary (13.4%), and others. The top ten business comprise about 21% of the funds.
The first five names in the fund are:
- Crowdstrike (NASDAQ:CRWD): Sunnyvale, California-headquartered cybersecurity technology group; up over 320% in 2020;
- Roku (NASDAQ:ROKU): San Jose, California-based streaming entertainment content platform; up over 145% in 2020;
- Trade Desk (NASDAQ:TTD): Ventura, California-headquartered digital-advertising platform; up close to 210% in 2020;
- Zscaler (NASDAQ:ZS): San Jose,California-based cloud security platform; up almost 33% in 2020;
- AstraZeneca (NASDAQ:AZN): British-Swedish biopharma giant, which has developed one of the COVID-19 vaccines in cooperation with Oxford University; up 0.3% in 2020; the company is also listed in the FTSE 100, the UK’s main index, where it has the second-largest market cap.
Since early October 2020, the fund has returned over 14.5%. Put another way, the proverbial $1,000 invested in QQQJ would now be close to $1,150.
We believe the fund deserves to be on investors’ shopping list in 2021. Many of the firms in the fund could possibly become household names in the coming years. Potential investors may want to consider buying the dips. Finally, like VTI, options are available on QQQJ.
