The S&P 500 has been on a wild ride in 2019. The index suffered a sharp sell-off in May after an escalation in the U.S.-China trade war sparked worries of a global economic slowdown. However, expectations of a more dovish Federal Reserve boosted the index to its best June performance since 1955. Weeks later, it was rallying to new highs above the 3,000 level.
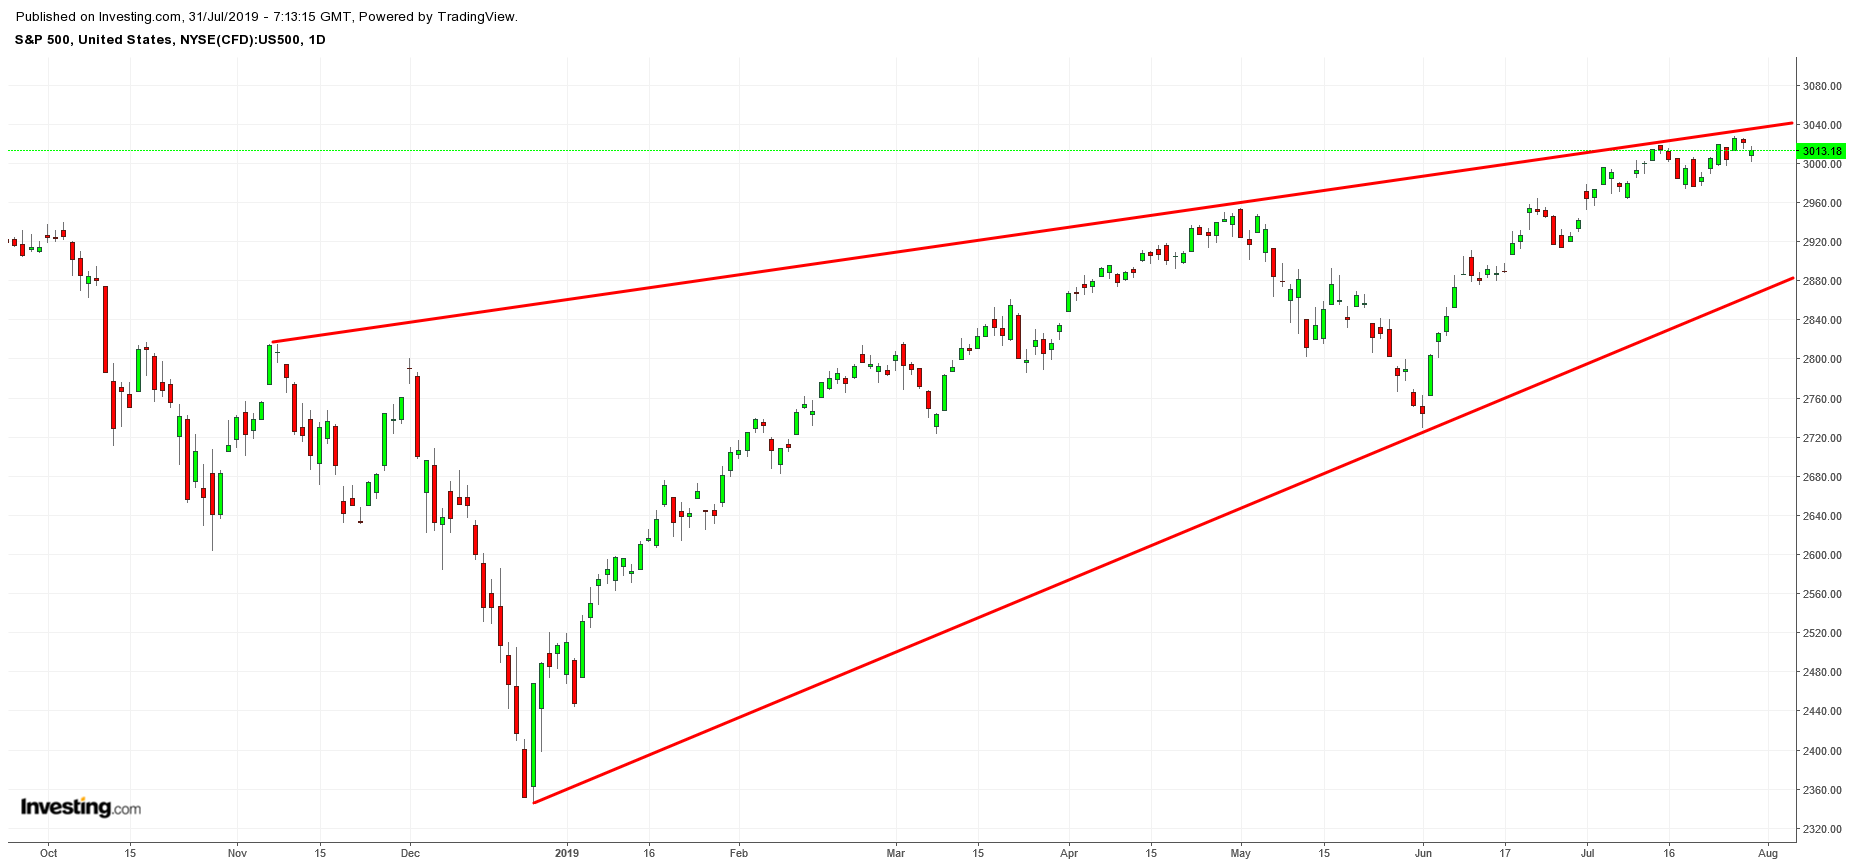
With the S&P 500 up around 20% year-to-date (YTD), the index has added $4.2 trillion in value, according to data from S&P Global Market Intelligence. Remarkably, only two sectors are responsible for generating the majority of the S&P 500’s growth in 2019: Information Technology and Communication Services.
1. Information Technology: Generated 25% Of S&P 500 Gains
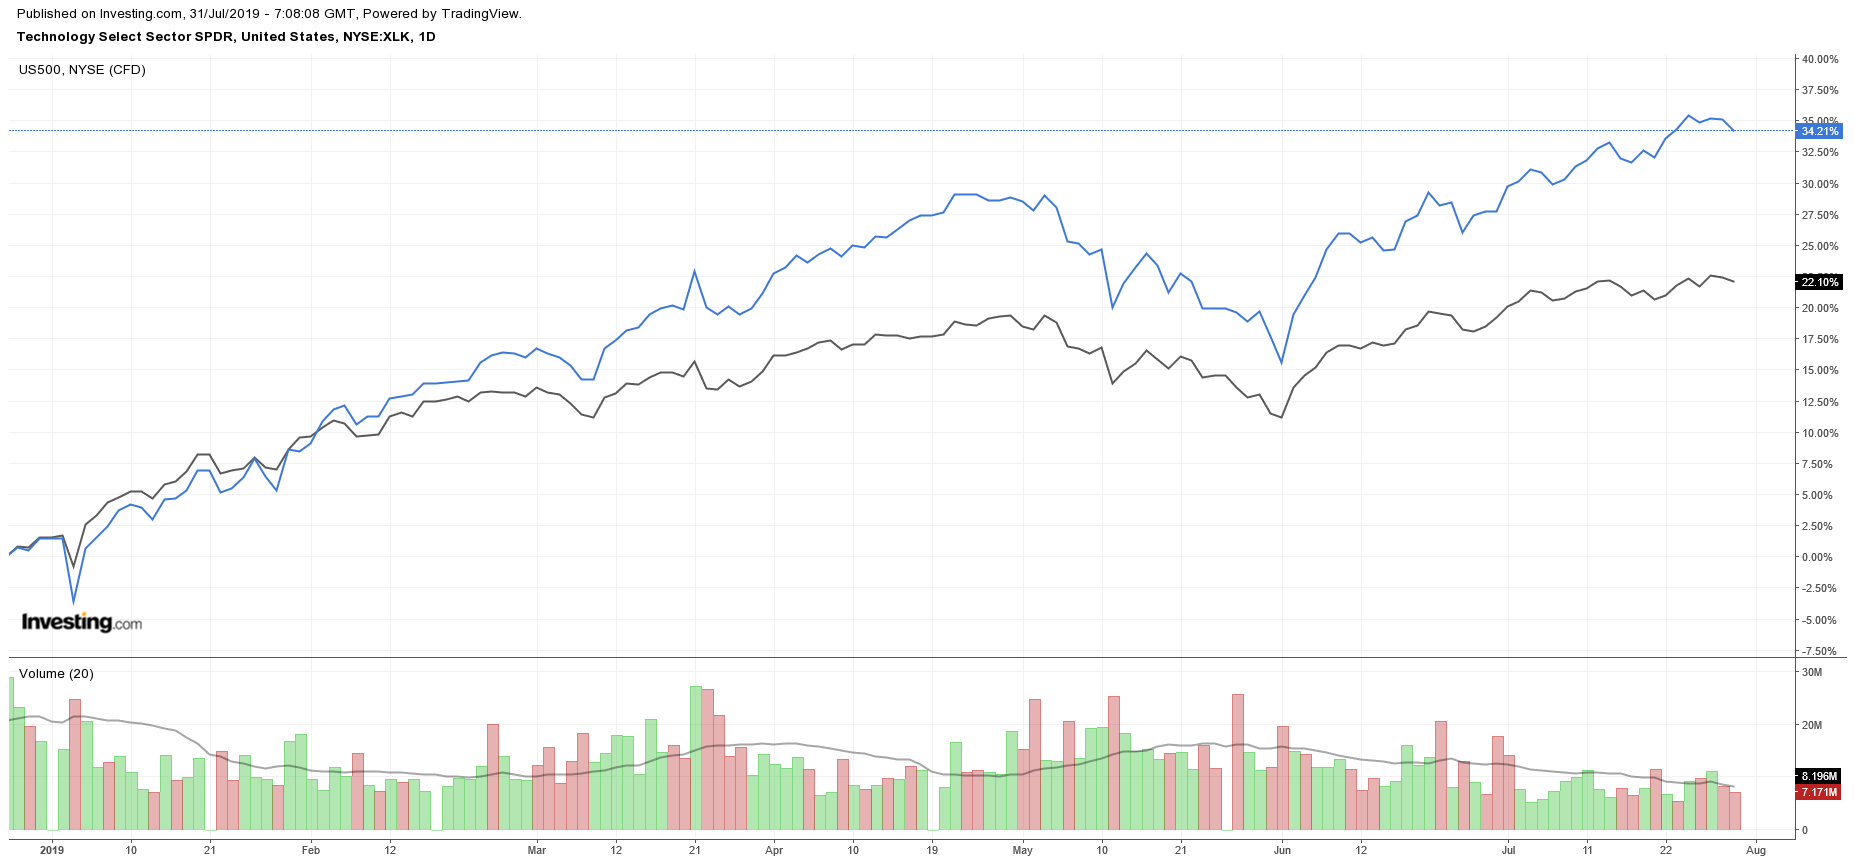
The Information Technology sector has been flying high in 2019, with the sector’s main ETF—the Technology Select Sector SPDR Fund—up 33% this year, outpacing the S&P 500’s YTD increase. The sector is responsible for around 25% of the S&P 500’s total YTD return.
When you consider the big names in this group, the exceptional sector gains come as no surprise.
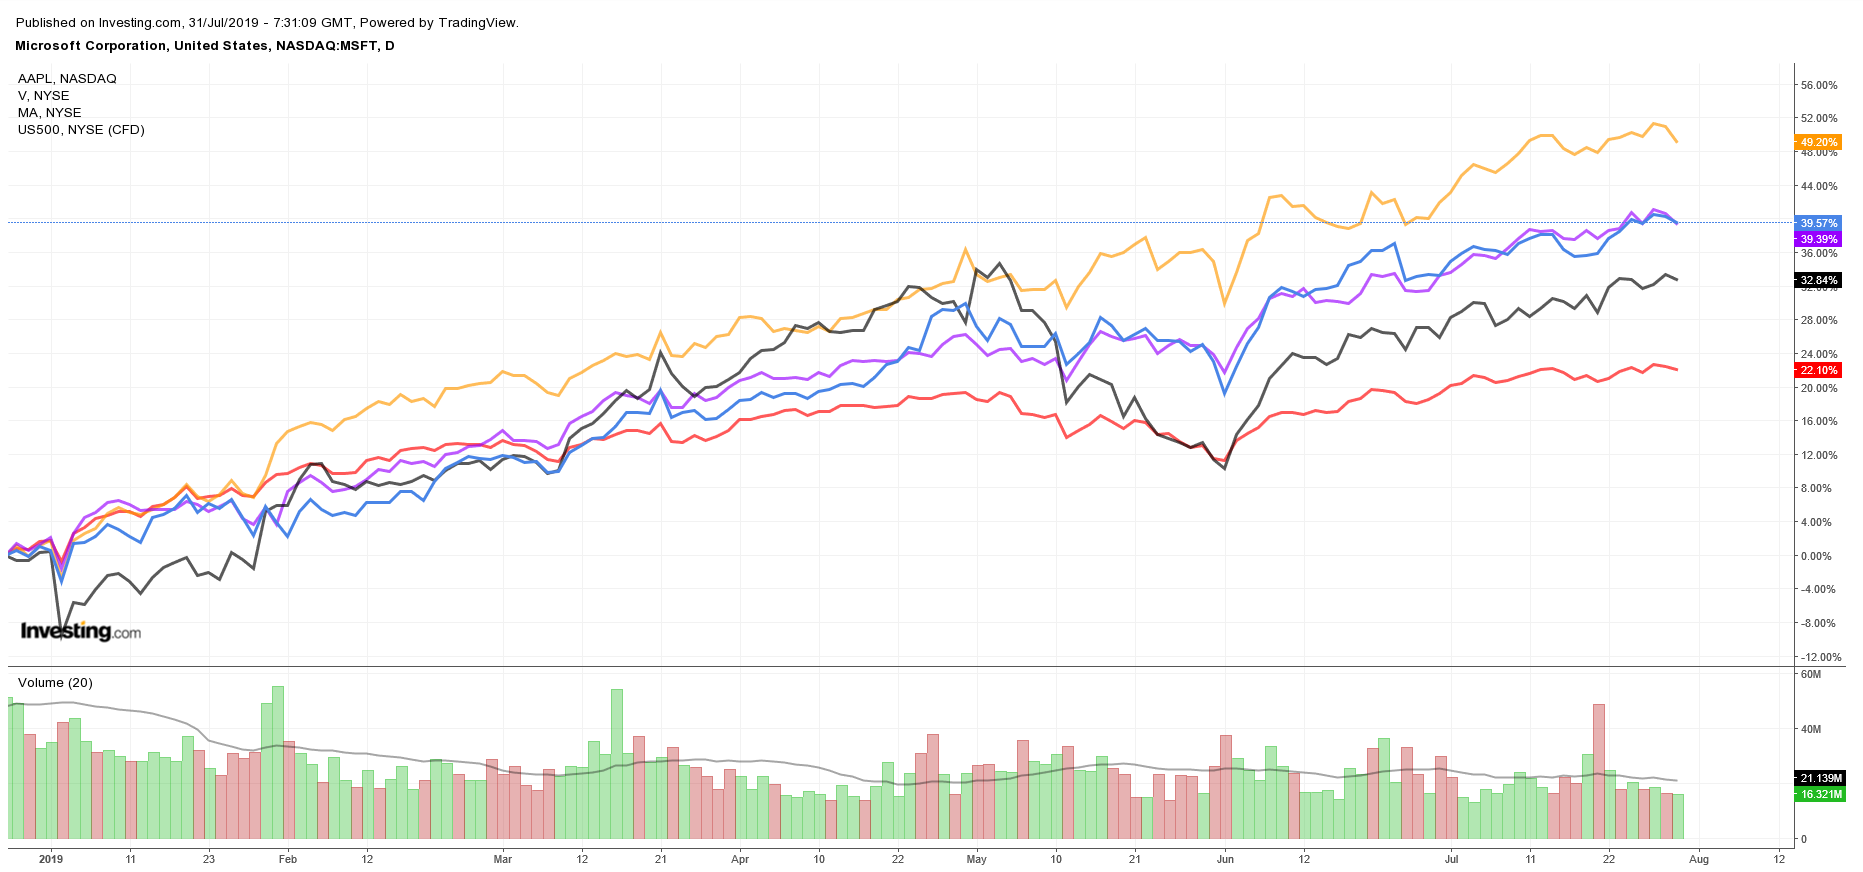
Microsoft (NASDAQ:MSFT)—the world’s most valuable company—has contributed the most to 2019's stock market rally. With its shares jumping 38% YTD, the Redmond, Washington-based software giant is responsible for 7% of the S&P 500’s total YTD gain. Microsoft has so far added $292 billion in value in 2019, taking its market cap to $1.07 trillion. The corporation has been riding high thanks to rapid growth in its Azure cloud-computing platform.
Apple (NASDAQ:AAPL) is the second-biggest name from the sector to contribute to the market’s YTD gains, accounting for nearly 5% of the S&P 500’s increase this year. Shares of the iPhone maker are up 33% in 2019, adding $204 billion to its market cap and taking its valuation to $960.6 billion. Investors have cheered the Cupertino, California-based company’s efforts to broaden its revenue base away from slowing iPhone sales by offering new services.
The third and fourth largest names in the sector accounting for the bulk of the market’s YTD gains both hail from the same industry: credit card payment processors. Visa (NYSE:V), with its stock up 38%, has accounted for 3% of the S&P 500’s YTD return. It has added $107 billion to its market cap this year, bringing its valuation to $394.4 billion. Mastercard (NYSE:MA), meanwhile, has seen its stock soar 47% this year, adding $92 billion in valuation to $280.9 billion. It is responsible for 2.5% of the index’s total gains so far this year. Both names have benefited from bullish prospects surrounding the shift in payment trends from paper to digital.
Other notable gainers in the group include Cisco (NASDAQ:CSCO), Intel (NASDAQ:INTC), Adobe (NASDAQ:ADBE), IBM (NYSE:IBM), and PayPal (NASDAQ:PYPL).
2. Communication Services: Generated 12% Of S&P 500 Gains
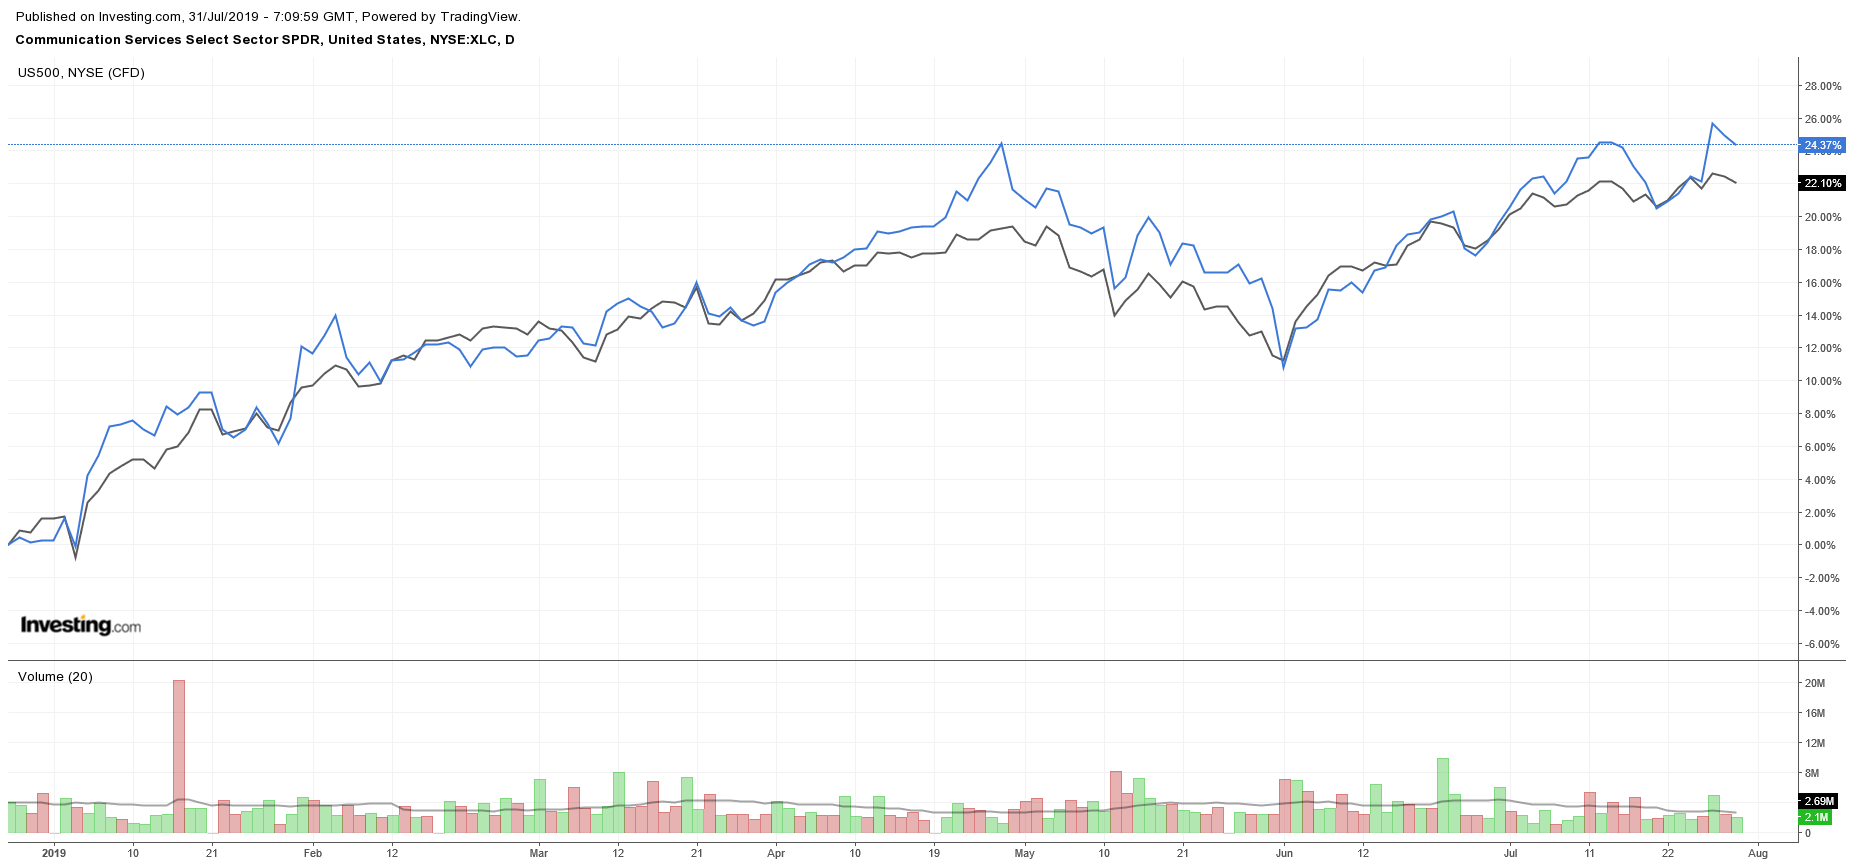
The Communication Services sector has been on a tear in 2019, with the sector’s most-traded ETF, the Communication Services Select Sector SPDR Fund, rising 25%.
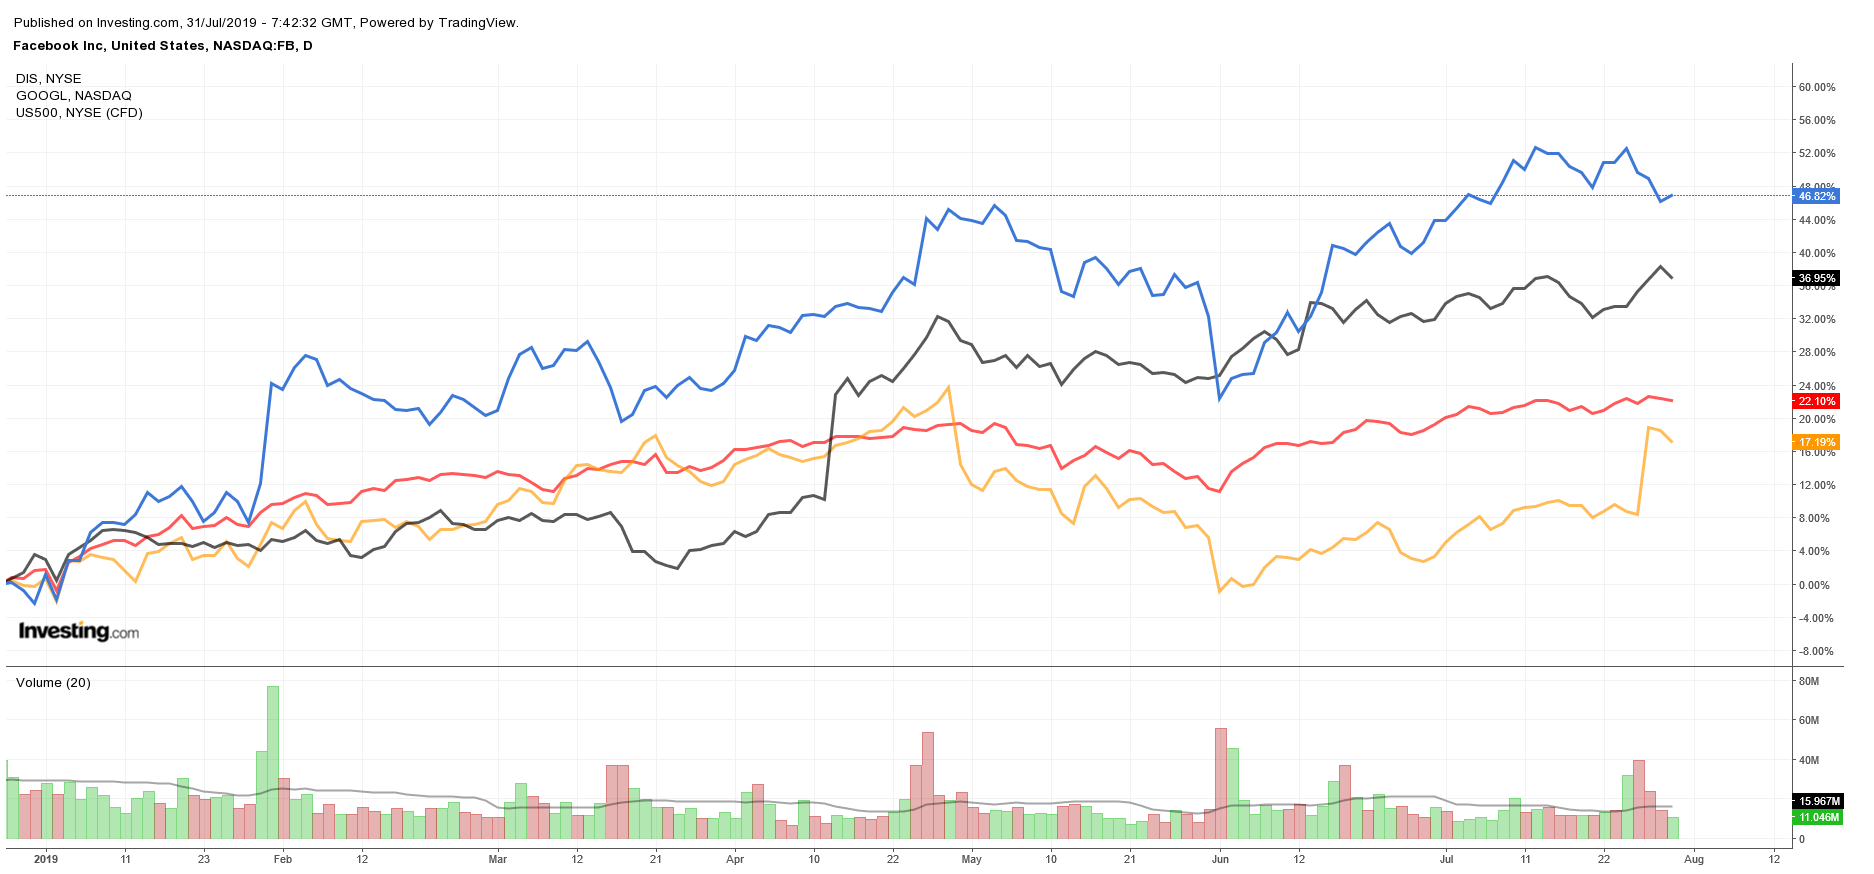
Digging deeper into the sector, Facebook (NASDAQ:FB)—a leader in the group—has generated the most to the S&P 500’s YTD gains, adding 5% to its total return. Shares of the social media network are up 50% this year, bringing its market cap to $562 billion, as advertisers continue to flock to the site despite privacy and regulatory concerns.
Next up, Walt Disney (NYSE:DIS) has generated 3% of the S&P 500’s YTD gains, making it the second-largest contributor for the group. The media giant’s stock has surged 33% so far this year, taking its market cap to $260.8 billion, as investors gear up for the launch of its highly anticipated Disney+ streaming service.
Google-parent Alphabet (NASDAQ:GOOGL) has also added significantly to this year’s market gains, with its shares climbing nearly 18%. The Mountain View, California-based company has seen its value increase by $63 billion this year to $850.6 billion, accounting for about 2% of the S&P 500’s YTD gain.
Other sizable gainers in the group include Netflix (NASDAQ:NFLX), AT&T (NYSE:T), Twitter (NYSE:TWTR), Comcast (NASDAQ:CMCSA), and Take-Two (NASDAQ:TTWO).
