Proactive Investors - Energy firms have repeated warnings that customers could face a rise in their bills from next week, despite Ofgem’s new, lower cap on prices being introduced.
Coming into force on Sunday, October 1, Ofgem’s new cap will fall from £2,047 currently to £1,932, which represents the amount a typical household would pay annually based on unit prices.
However, given the figure is an estimate based on the amount suppliers can charge per kilowatt hour of electricity and gas, increased daily standing charges may contribute to higher bills.
Suppliers will be able to charge 27.35p and 6.89p for electricity and gas respectively from Sunday, down from 30p and 8p in July’s cap.
New daily standing charges of 53.37p and 29.62p actually mark a slight increase meanwhile.
Given a lack of government support this winter on top of this, comparison site Uswitch warned some may find bills increase heading into the colder months as consumption grows.
“Most households will face similar, or in some cases more expensive, energy bills,” Uswitch energy expert Natalie Mathie warned.
“Remember that the price you pay is determined by how much energy you use. The more you use, the more you’ll pay.
This is in spite of the immediate £124 drop in the cap price between July and October, and an even larger reduction from the £3,549 set for late 2022.
So how does it work?
Having been introduced in 2019, the price cap is meant to provide a ceiling on how much energy suppliers can charge households for power.
This is done by placing a cap on the amount that can be charged per unit of gas and electricity, which currently sits at 8p and 30p per kilowatt-hour respectively.
How much the average typically consuming household would then pay on an annual basis is the figure displayed in Ofgem’s price cap.
For the quarter from July to October, this was set at £2,074. However, given the cap actually determines unit prices, households could end up paying more or less than this over a year.
A host of factors contribute to the final figure, including, of course, the wholesale price of energy, but also the likes of network and operating costs.
Thanks to allowances in Ofgem’s caps so far this year, suppliers such as British Gas and Eon have been able to hike bills to recoup losses faced early on during the energy crisis.
This ultimately saw British Gas pen a near-900% rise in operating profit during the first six months of the year – sparking heated scrutiny of Ofgem given many households are still struggling with high prices.
On the plus side, when Ofgem introduced its current cap in July, energy prices fell for the first time since February 2020.
Though the government’s energy price guarantee had limited average bills to £2,500 for ten months from October, the drop reflected lower wholesale prices, which dipped below pre-Ukraine war levels last December.
UK Natural Gas (GBp/thm) late 2018 - current - Trading Economics
Owing to higher wholesale prices, the price cap has effectively become a means for suppliers to determine how much to charge, rather than a maximum limit on prices.
“Unfortunately, the price cap alongside other Ofgem rules currently in place, have failed to bring about meaningful competition,” Uwitch director Richard Neudegg explained.
“Suppliers have no incentive to offer better prices to anyone […] and when suppliers have no incentive to attract new customers, consumers lose out.”
A lower cap marks the second fall this year for the majority, following sustained increases in the price cap from early 2020 to last April.
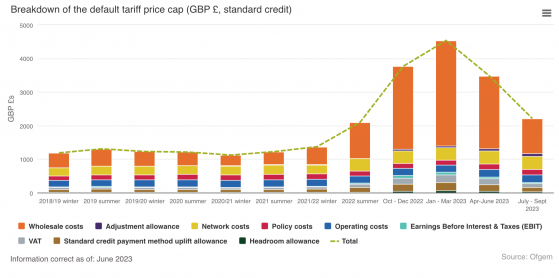
Historical price cap figures:
- January 2019 - £1,137
- August 2019 - £1,179
- February 2020 - £1,042
- February 2021 - £1,138
- August 2021 - £1,277
- April 2022 - £1,971
- October 2022 - £3,549 (£2,500 government price guarantee introduced)
- January 2023 - £4,279
- April 2023 - £3,280
- July 2023 - £2,074 (government price cap raised to £3,000)
- October 2023 - £1,923
Read more on Proactive Investors UK
