Benzinga - by Piero Cingari, Benzinga Staff Writer.
Once haunted by a domestic real estate collapse reminiscent of a Lehman-like crisis, Chinese stocks witnessed a significant rally in the first part of the year, reviving investor bets on the beginning of a more serious and robust recovery.
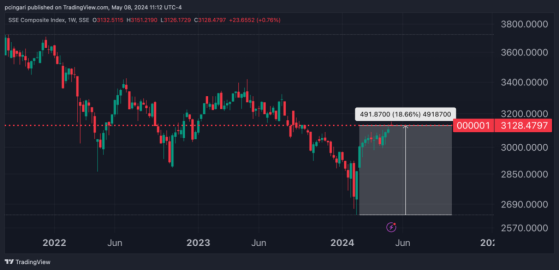
On Tuesday (May 7), the SSE Composite Index, which includes all stocks listed on the Shanghai Stock Exchange, reached its highest level since September 2023, showcasing a rally of about 19% from the lows in 2024.
The revival in Chinese stocks can be attributed to a confluence of factors. Key among these is the country’s economic recovery, which has gathered pace after years of turbulence following the bursting of a real estate bubble.
China's economy expanded by 5.3% in the first quarter year-over-year. This growth rate not only outpaced the previous quarter’s 5.2% but also exceeded the 5% growth expected by analysts.
Surveys on private sector economic activity showed signs of strength in April 2024, with the Caixin Services PMI marking the highest level since May 2023 and the manufacturing PMI also notching expansionary conditions.
Additionally, technical factors such as the massive exit of foreign investors, which put an end to fear-driven selling, have played a crucial role.
Chart: Chinese Stocks Have Rebounded 19% Off 2024 Lows – More To Come?
Are Investors Overestimating China’s Market Recovery? Stock Surge vs. Earnings Reality There is a risk investors are moving too early in betting on a Chinese recovery as the earnings season thus far as mostly disappointed expectations.
As Bank of America’s strategist Willie Chan reported recently, 77% of Chinese A-shares stocks revised down 2024 earnings, with all sectors witnessing net downward revisions.
“We believe a fundamental turnaround in economy and earnings would take time,” Chan stated.
“The MSCI China lowered 2024E earnings growth from 15.8% YoY in Jan-24 to 12.1% YoY in Apr-24. We are concerned the market will need to further revise down 2024 earnings,” he added.
The expert noted that while recent macroeconomic data indicated emerging signs of improvement, the first quarter results were still a reflection of the difficult operating environment.
A Look at ETFs Tracking China’s Economic Rebound Several (non-levered) exchange-traded funds are available for U.S.-based investors in get exposure to China’s ongoing economic rebound, each with its unique portfolio and strategy. Here's how they stand:
KraneShares CSI China Internet ETF (NYSE:KWEB)
- AUM: $6.00 Billion
- Number of Holdings: 34
- Top Holdings: Tencent Holdings ADR (OTCPK: TCEHY); Alibaba Group Holding Ltd. (NYSE:BABA); PDD Holdings Inc. – ADR (NASDAQ:PDD)
- Benchmark: CSI Overseas China Internet Index
- Net Expenses: 0.70%
- Year-to-date Return: 9.52%
- Distance From All-Time High: 220%
- AUM: $5.24 Billion
- Number of Holdings: 671
- Top Holdings: Tencent; Alibaba; PDD
- Benchmark: MSCI China Index
- Net Expenses: 0.58%
- Year-to-date Return: 7.85%
- Distance From All-Time High: 108%
- AUM: $4.84 Billion
- Number of Holdings: 58
- Top Holdings: Tencent; Meituan ADR (OTCPK: MPNGY), Alibaba
- Benchmark: FTSE China 50 Index
- Net Expenses: 0.74%
- Year-to-date Return: 11.53%
- Distance From All-Time High: 90%
- AUM: $482.09 Million
- Number of Holdings: 1,182
- Top Holdings: Tencent; Alibaba; PDD
- Benchmark: S&P China BMI Index
- Net Expenses: 0.59%
- Year-to-date Return: 5.49%
- Distance From All-Time High: 101%
- AUM: $294.50 Million
- Number of Holdings: 526
- Top Holdings: Kweichow Moutai Co., Ltd.; Contemporary Amperex Technology Co., Ltd.
- Benchmark: MSCI China A Inclusion Index
- Net Expenses: 0.60%
- Year-to-date Return: 4.15%
- Distance From All-Time High: 70%
- AUM: $158.22 Million
- Number of Holdings: 61
- Top Holdings: Trip.com Group Ltd. (NASDAQ:TCOM), Baidu Inc. (NASDAQ:BIDU)
- Benchmark: NASDAQ Golden Dragon China Index
- Net Expenses: 0.70%
- Year-to-date Return: 0.69%
- Distance From All-Time High: 216%
- AUM: $111.49 Million
- Number of Holdings: 962
- Top Holdings: Tencent; Alibaba; PDD
- Benchmark: FTSE China Capped Index
- Net Expenses: 0.19%
- Year-to-date Return: 7.66%
- Distance From All-Time High: 106%
Photo: Shutterstock
© 2024 Benzinga.com. Benzinga does not provide investment advice. All rights reserved.
Read the original article on Benzinga
