This article was written exclusively for Investing.com
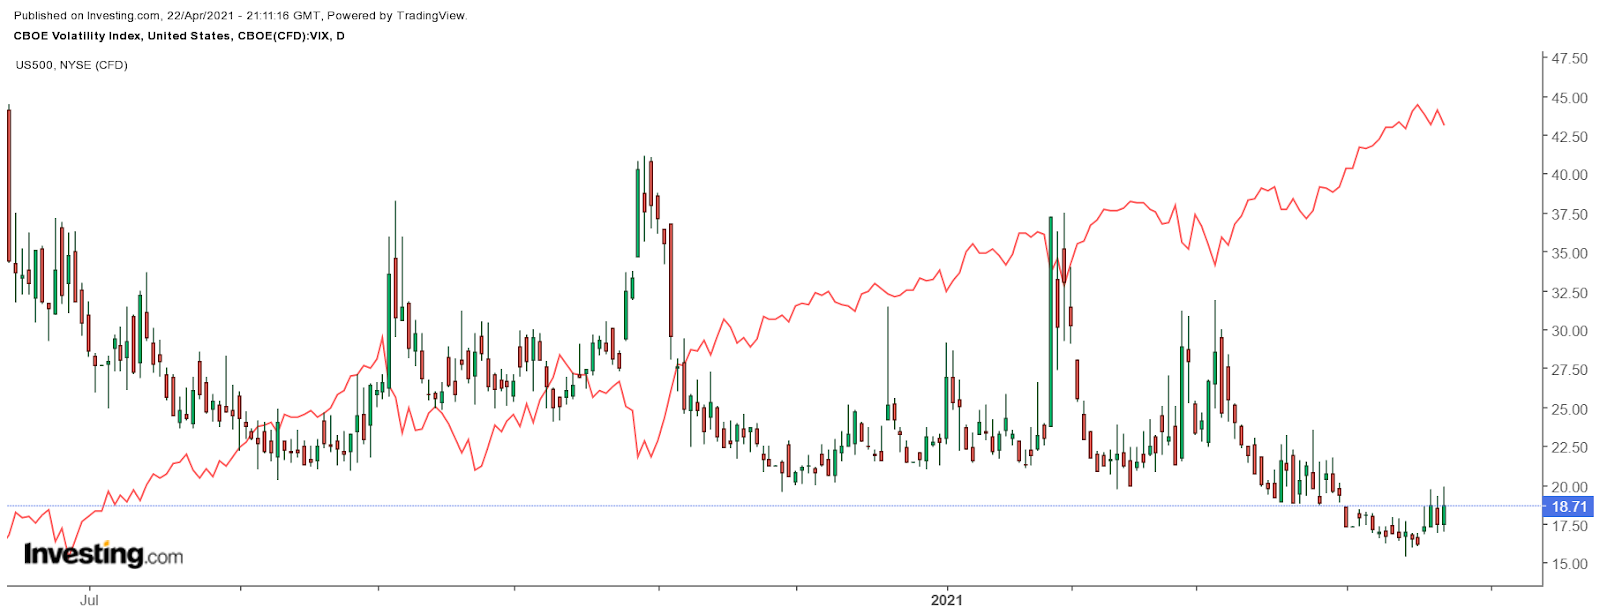
Volatility levels, as measured by the VIX Volatility Index, have been falling. The index has recently slid to its lowest level since the pandemic crash of March 2020. Don’t tell that to the options traders because they have been aggressively placing bets that suggest that volatility levels rise sharply, sending the VIX to much higher levels.
With the S&P 500 in melt-up mode, soaring by nearly 7% since Mar. 26, the VIX has tumbled. The VIX index had been stuck around 20 for a very long time. Finally, it started to break lower at the beginning of April, dropping to 16 by the middle of the month, its lowest since February 2020.

Betting Volatility Spikes
The sharp decline in the VIX has helped act as a tailwind for the equity market, pushing stocks to new records. But now, options traders appear to be betting that VIX sees a significant reversal and rises sharply. On Apr. 8, the open interest for the July 21, 25 and 40 calls rose by more than 235,000. It appears to have been a spread transaction. The 25 calls were bought for about $3.30 per contract, while the 40 calls were sold for around $1.30 per contract. It suggests that the VIX is trading above 27 but below 40 by the expiration date.
The Sept. 15, 20 calls were active on Apr. 19 and 20, with open interest rising by a combined 20,000 contracts. These calls were purchase for between $6.40 and $6.80 per contract. It would imply that the VIX is trading around 27 by the middle of September.
Finally, on Apr. 20 and 21, the open interest for the May 60 calls rose by 20,000 contracts each day. This was a much smaller wager, with the calls bought for around $0.25. It would be an inexpensive way for a trader to get long volatility ahead of a move up.
All of this suggests options market participants are looking for higher volatility in the weeks and months ahead. Perhaps even taking advantage of the VIX’s recent decline to buy volatility while it is inexpensive.
A Strange Divergence

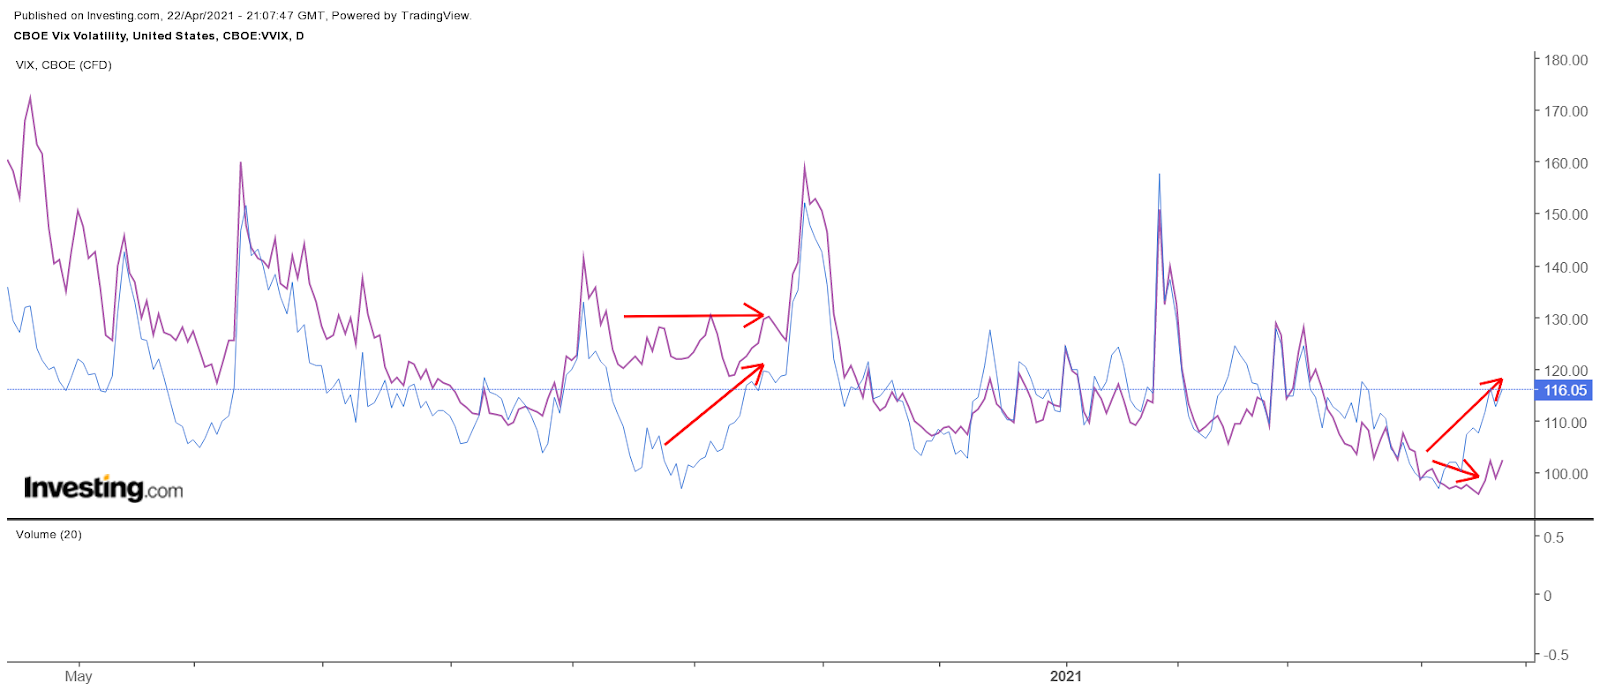
More interesting is that the CBOE Vix Volatility (VVIX), which measures the implied volatility levels of the VIX, has been rising recently. This comes despite the VIX index itself falling. A strange divergence indicates that implied volatility levels are on the rise beneath the equity market’s calmness and falling VIX.
In more recent times, we have seen these two measures of volatility diverge. It has typically led to the VIX index catching up and rising with the VVIX index during those times. The last time we saw something like this happen was towards the end of September when the VVIX started to creep higher as the VIX traded sideways. Ultimately it led to the S&P 500 falling by roughly 9% from Oct. 12 through Oct. 30.
With the market rushing to record high after record high every day, it can become easy to lose sight that the stock market can go down. But at some point, volatility is likely to pick up, and that means stocks may drop, and by the looks of things, it could very well be sooner than you think.
