- The stock market is cyclical and corrections are normal
- The best way to avoid getting caught up in short-term volatility is to focus on the long term
- Corrections can be scary, but they are also an opportunity to buy stocks at a discount
- Apple (NASDAQ:AAPL)
- Microsoft (NASDAQ:MSFT)
- Nvidia (NASDAQ:NVDA)
- Alphabet (NASDAQ:GOOGL)
- Tesla (NASDAQ:TSLA)
- Meta (NASDAQ:META)
- Having unrealistic expectations: Unrealistic hopes for extraordinary short-term gains can lead to dissatisfaction and disappointment. Adopting a practical long-term outlook often results in more favorable returns.
- Overconfidence: Excessive confidence can lead to erroneous judgments.
- Forgetting downturns: Bullish market rallies can blind investors to the inevitable cyclical nature of markets. Corrections of around 10% are quite common, and it's in such instances that investors may feel losses more acutely than gains.
Think about the stock market: Some days, it performs strongly, reaching new highs, but on other days, it experiences drops that can dampen investor confidence. This continuous back-and-forth movement leads many to mistakenly choose short-term trading strategies and book huge losses.
Even though the market might undergo an extended rally, we often only notice these trends at the very end, when it's too late. And by the time we decide to invest, the downturn has already ensued, affecting our morale.
Instead of fixating on new highs, we should embrace moments of weakness (including declines) as valuable buying opportunities.
Our focus should shift to long-term returns, sidestepping short-term volatility. Over the past 30 years, the S&P 500 has averaged an annual return of +10%.
Corrections, again, are not setbacks but rather openings for smart investors. However, it's important to be cautious about the noise. Every piece of economic data is intricate and subject to revisions, and interpreting how it fits into the bigger picture is challenging.
Volatility, pullbacks, and sudden price surges are all part of the norm.
Keeping trends in mind helps prevent overreactions, and assessing charts holistically can provide insights. Utilizing trend lines or moving averages can also aid in this process.
So, with that in mind, let's take a look at some interesting charts and try to analyze them.
MSCI World
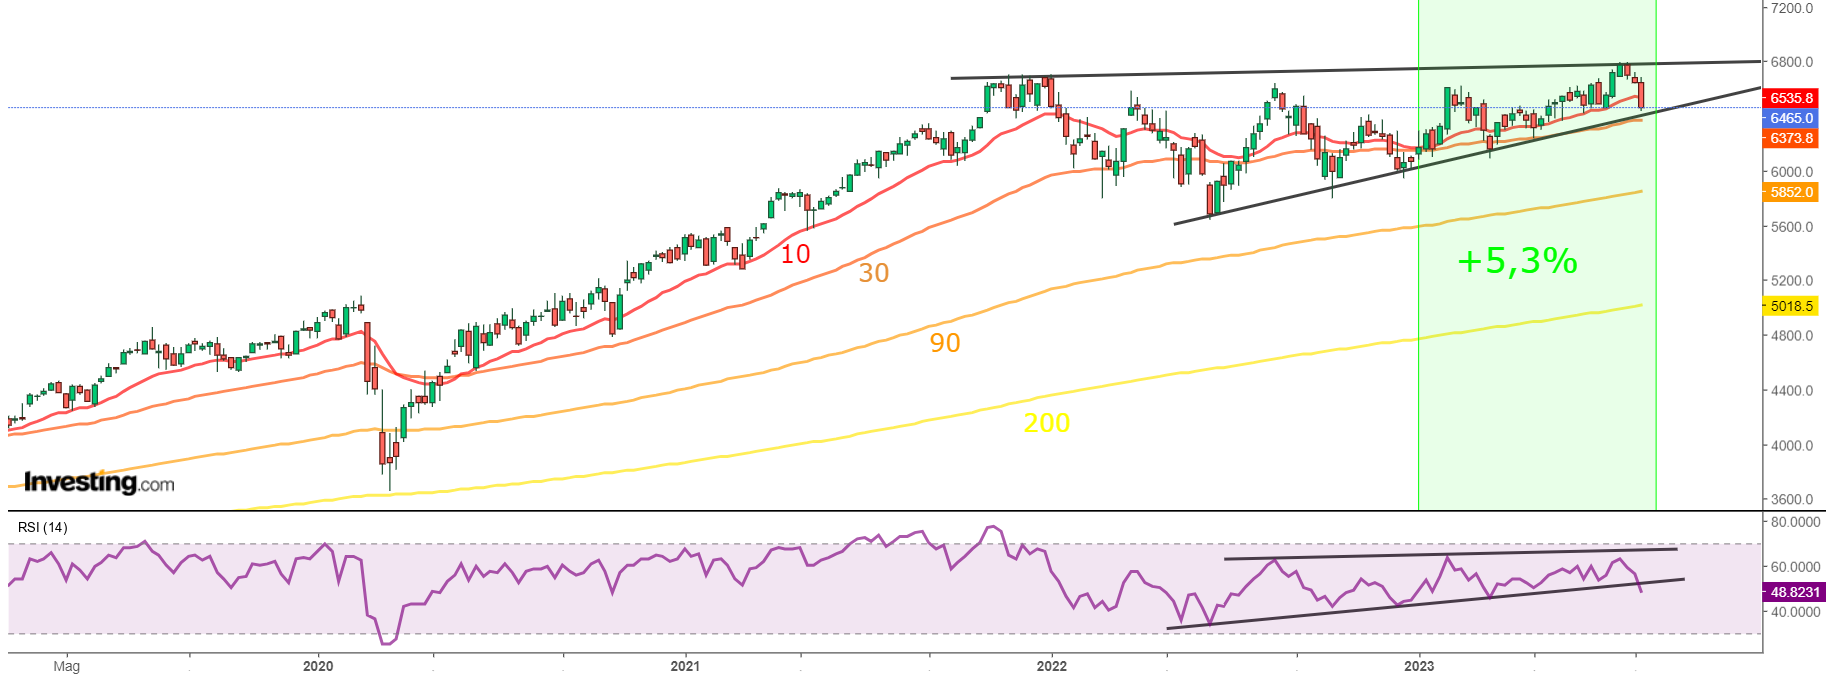
 Since the start of the year, the MSCI All-Country World Equity Index has performed well, maintaining the upward trajectory that originated from the COVID-related lows. This situation is aptly described by the RSI indicator.
The collection of worldwide stocks has achieved higher highs, reaching new all-time highs, and has remained in proximity to the overbought level (around an average of 55 points).
Subsequently, it formed an ascending triangle pattern, hinting at a possible upward breakout, accompanied by the indicator dipping below the 50 level.
Currently, the Fibonacci retracement levels have not yet been touched due to the strong previous trend. In the event that the pattern breaks downward, a potential target could be the 90 average (5650), followed by a more substantial decline to the 200 average (4980).
S&P 500
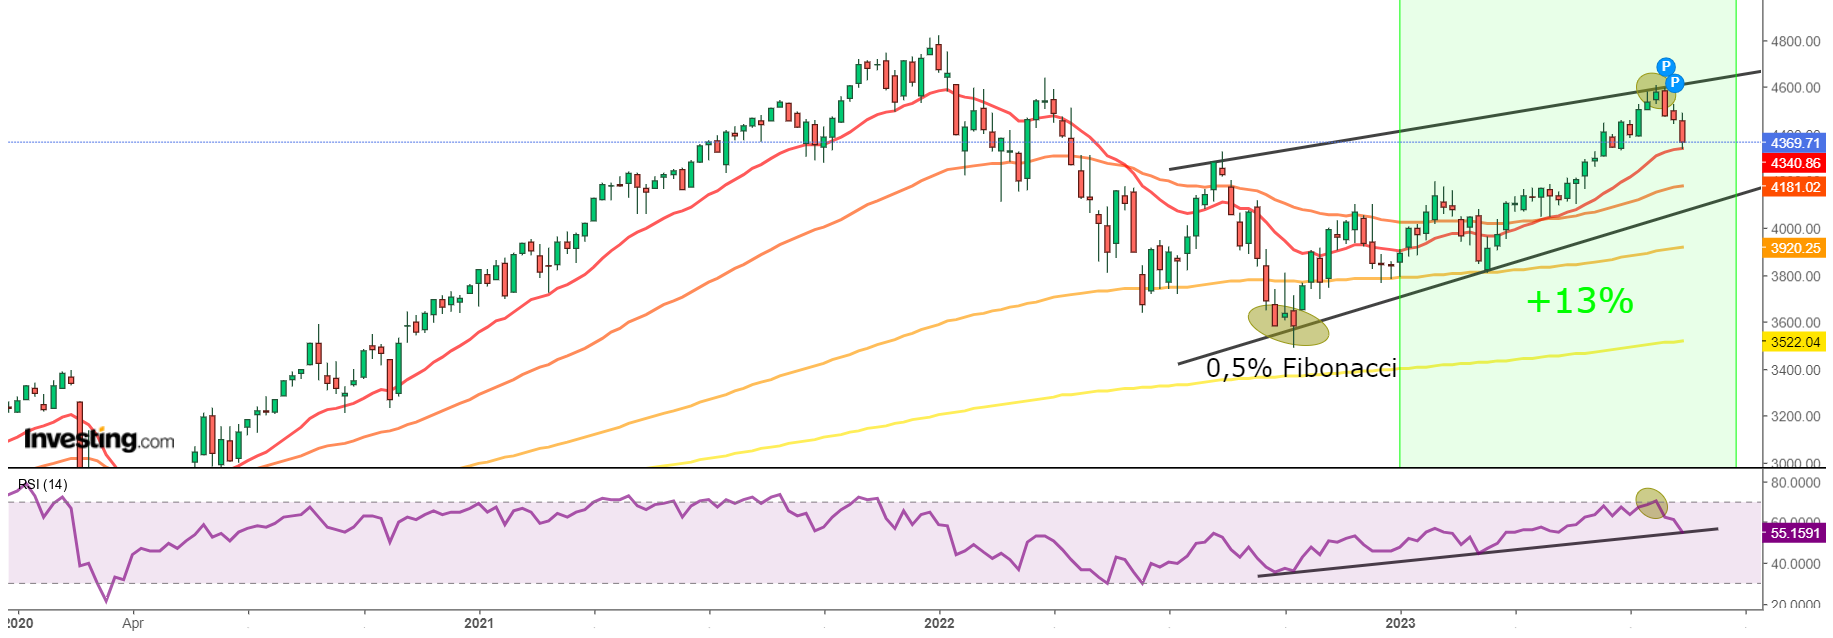
 Since the start of the year, the S&P 500 has achieved a return of +13%. The index rallied after hitting lows in October 2022 at 3583 points. The RSI indicator accurately reflects the situation.
The S&P 500 has formed a bullish parabola leading to a new yearly high, coming close to the all-time high (within -3.6% range), which corresponds to the overbought level (70). Subsequently, it experienced a pullback, retracing near 50.
The robust trend that commenced in March has not shown signs of fading, thereby not prominently highlighting the Fibonacci retracement levels.
Consequently, after reaching the recent peak in the last few sessions, a natural pause towards the 4100-point mark is likely, aligning with 30 on the RSI.
Nasdaq 100
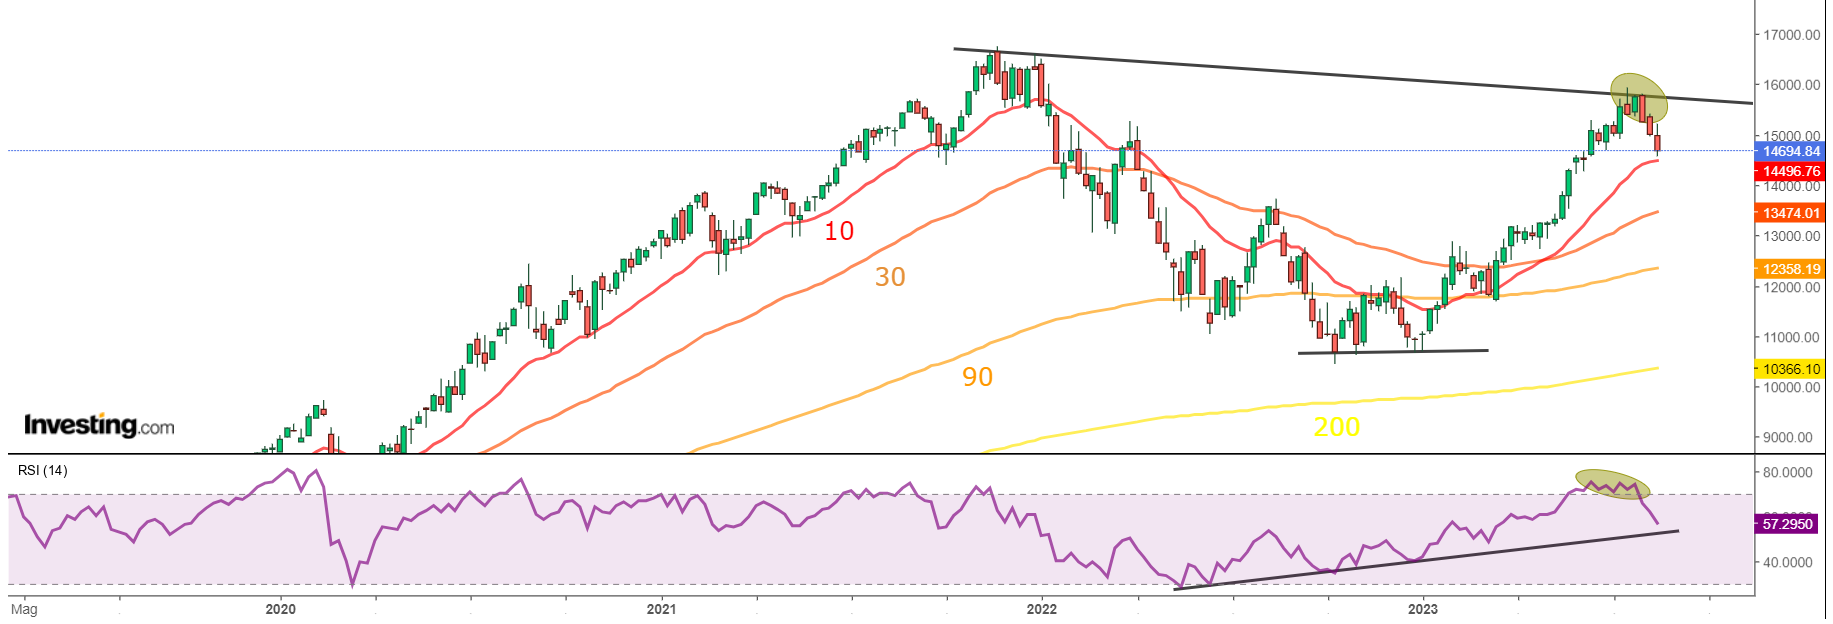
 The Nasdaq 100 has displayed positive performance since the beginning of the year, initiating an upward trend from its October 2022 low at 10692 points. The RSI indicator accurately reflects this situation.
The index reached new highs with a remarkable +35% gain so far this year. The RSI indicator confirmed this trend by surpassing the overbought level (70), followed by a subsequent pullback.
After peaking in recent trading sessions, it's reasonable to anticipate a natural pause around the 13850-point mark, potentially followed by a deeper retracement to 12650 points, which aligns with the Fibonacci levels.
Do you notice the common thread among the previous indices? They all boast a high percentage of top-tier stocks within the S&P 500:
The world's largest ETF, the World ETF (with assets of 51 billion), consists of 66.49% U.S. stocks, making up two-thirds of the entire basket. This poses an interesting question: Is this composition a limitation or an advantage, given that these are some of the most prominent companies in recent years?
Euro Stoxx 50
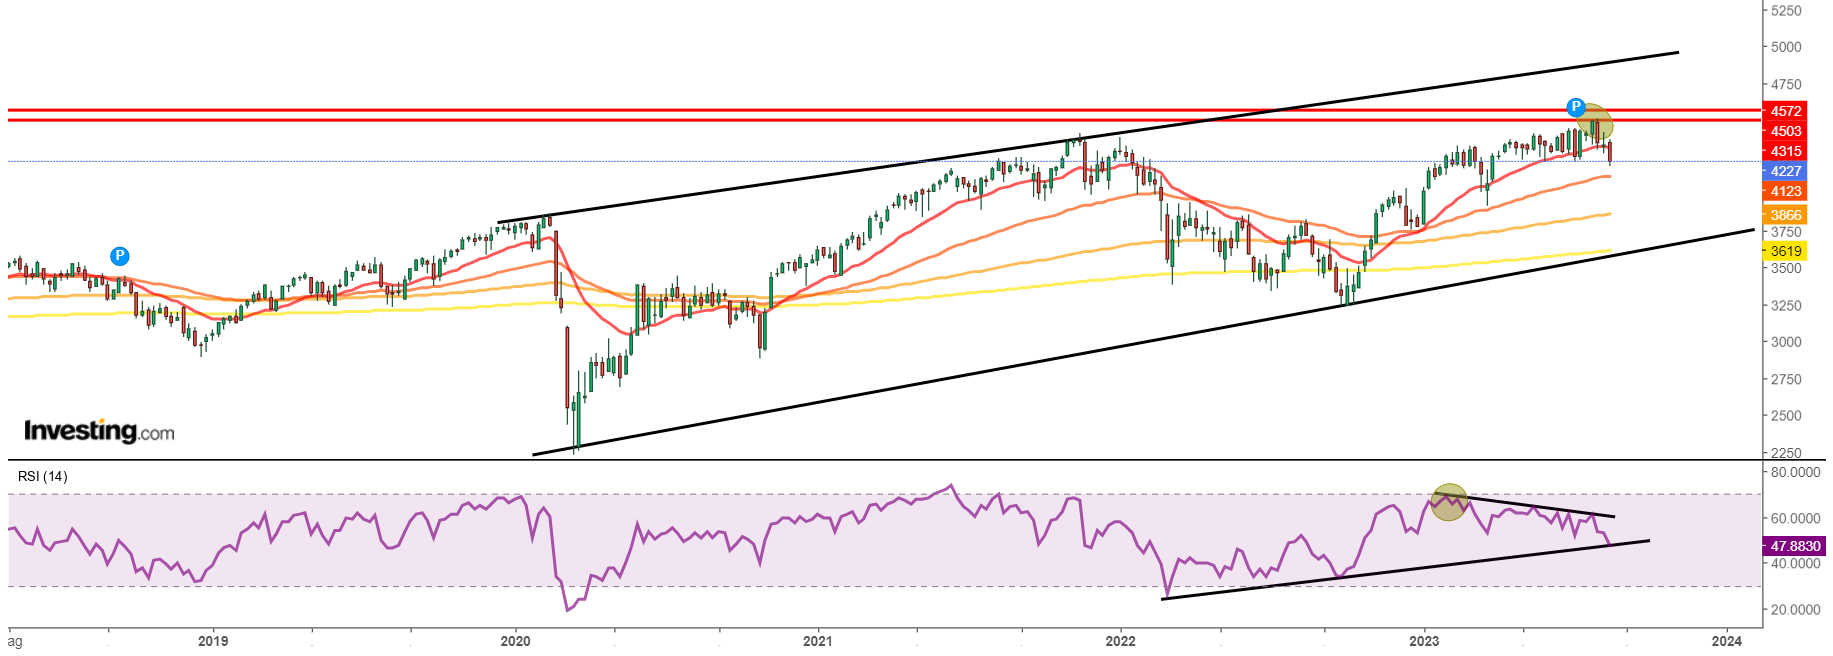
 The Euro Stoxx 50 has experienced a robust bullish trend since the start of the year, initiating this trend from its October 2022 low at 3240 points. The RSI indicator aptly portrays this situation. The index has formed a bullish channel and achieved a remarkable 12% performance from January 2023, reaching the yearly high at 4500 points, which is in proximity to the 2007 highs.
The RSI indicator validated this trend by initially signaling the overbought level (70), followed by indicating possible weakness that resulted in a rejection of the highs and a subsequent retreat. Currently, the Fibonacci retracement levels have not been interacted with.
If a natural decline transpires, there's potential for a retracement to the 30 average (around 4000 points) or a deeper decline to the 90 average (approximately 3750 points) while still remaining within the established pattern.
The Key Takeaway
Warren Buffett and Charlie Munger have frequently discussed the importance of avoiding certain pitfalls and maintaining a long-term perspective:
Investors with medium- to long-term horizons are advised to remain steadfast against the sway of very short-term corrections in the markets and the news surrounding it.
***
Disclaimer: This article is written for informational purposes only; it does not constitute a solicitation, offer, advice, or recommendation to invest as such it is not intended to incentivize the purchase of assets in any way. I would like to remind you that any type of asset, is evaluated from multiple points of view and is highly risky and therefore, any investment decision and the associated risk remains with the investor.

