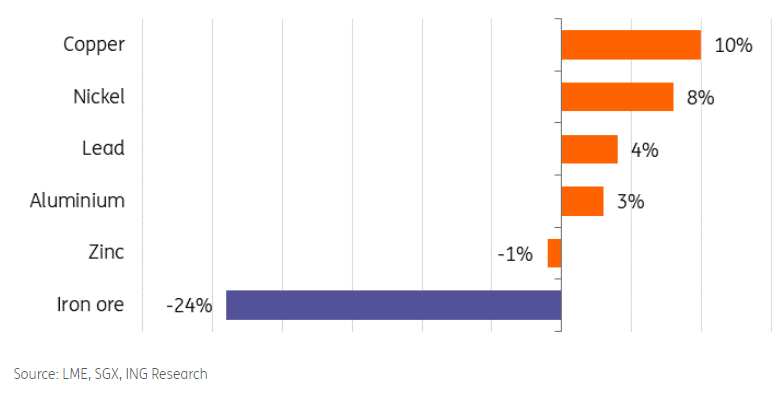
Copper and iron ore prices are diverging
Prices of copper and iron ore diverging quickly with copper prices surging above $9,000/t, while iron ore is trading closer to the $100/t level.China’s concerns over the ongoing property crisis have weighed on the iron ore market, while copper benefits from rising demand for electric vehicles (EVs) and renewable energy.
While traditional demand drivers, such as property and construction, face headwinds, demand from the green energy sector continues to grow, and iron ore doesn’t benefit from that.
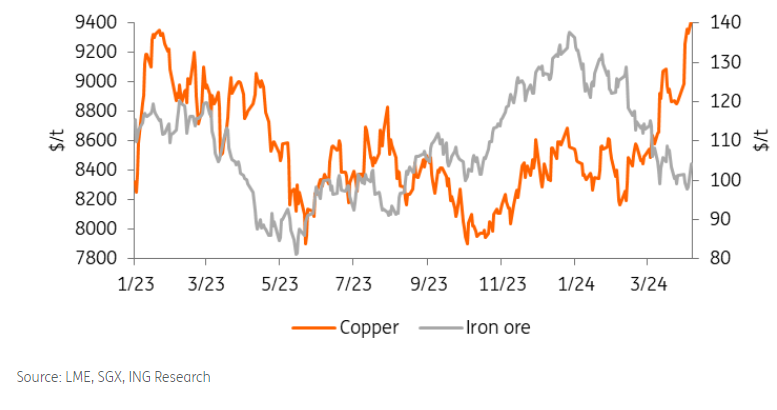
This divergence is likely to deepen as China’s economy undergoes a major transition towards 'high-quality growth' and Beijing pursues new growth drivers in sectors including clean energy and high-tech manufacturing. The property sector makes the bulk of steel demand but so far there have been little signs of massive fiscal stimulus by Beijing in the construction and property sectors. It appears more focused on the 'new three' growth drivers: EVs, batteries and solar panels.
Copper is used in everything from EVs to wind turbines and power grids. In EVs, copper is a key component used in electric motors, batteries and wiring, as well as charging stations. Copper has no substitute for its use in EVs, wind and solar energy, and its appeal to investors as a key green metal will continue to support higher prices over the next few years.
Last year, rising demand for renewables and EVs in China already offset the slump from the more traditional sectors like the property market, and we expect this shift in demand drivers to continue this year.
The surge in copper prices has also been driven by unexpected supply constraints, in particular the closure of Canada’s First Quantum mine in Panama. The Cobre Panama copper mine was one of the world’s largest sources of copper, accounting for around 1.5% of global copper output.
Iron ore slumps on disappointing demand
Iron ore has sold off more than 20% this year, with prices dropping below $100/t to their lowest since August. The fundamentals are deteriorating; steel demand in China continues to disappoint, and the gloom in the country’s property sector drags on. Although China’s overall manufacturing activity rebounded in March, its steel industry PMI remained in contraction territory.
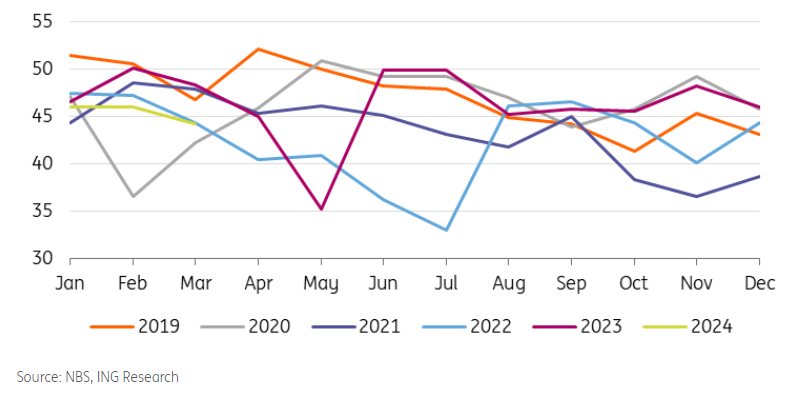
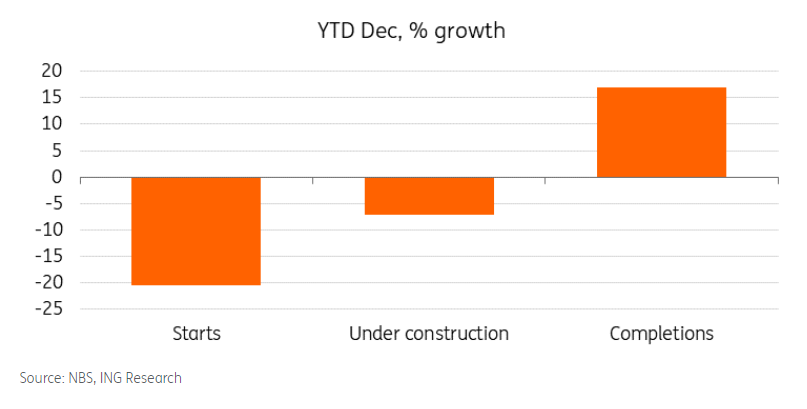
As for China’s property slowdown, the country’s new home starts – the biggest steel demand driver – fell sharply in 2023, down by more than 20%. This should continue to suppress steel demand this year. Property makes up most of China’s steel demand. Futures for reinforcement bars, a key construction product, recently hit the lowest level in Shanghai since 2020, signalling the country’s property crisis is dragging on.
The government has so far held off delivering a big enough stimulus package to revive China’s ailing property sector. The usual increase in construction activity in the spring has also failed to materialise, and iron ore and steel inventories are climbing.
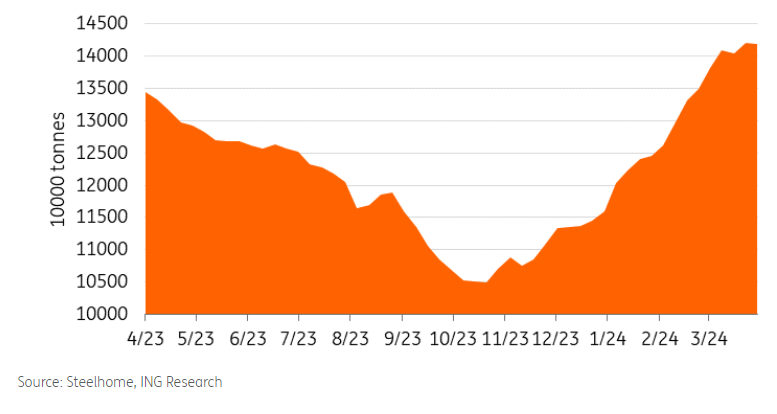
Iron ore inventories in China surged 24% in the first quarter – the biggest three-month increase in percentage terms since 2014. China’s iron ore port inventory is a key indicator that reflects the supply and demand balance, as well as the safety net and imbalance between the iron ore supply and the steel mill demand. With the seasonal uptick in demand not yet materialising, the drawdown in stocks might be delayed. We believe high iron ore availability in China will continue to put pressure on prices.
The China Iron & Steel Association recently called on domestic steel mills to “reduce production intensity” as the property downturn and slowdown in the infrastructure sector delay steel demand recovery.
Downside risks are likely to prevail in the near term for iron ore prices amid subdued steel demand. China will continue to drive iron ore prices going forward, and the supply and demand balance will largely depend on China’s steel demand outlook. A further boost for China’s property sector will be crucial in supporting demand. We see prices averaging $100/t in Q2 with a 2024 average of $106/t.
Copper rallies on tightening supply
This slump in iron ore prices contrasts with copper, which is trading at its highest since the middle of 2022, up 10% so far this year, fuelled by supply risks and improving demand prospects for metals used in the green energy transition.
The main catalyst for copper’s rally is the unexpected tightening in the global mine supply, most notably First Quantum’s mine in Panama, which has removed around 4000,000 tonnes of the metal from the world’s annual supply. In addition, Anglo American (JO:AGLJ) said it was cutting output by 200,000 tonnes. And Codelco, the world’s biggest copper producer, is struggling to recover from the lowest output in a quarter of a century.
Most recently, Ivanhoe Mines reported a 6.5% quarterly drop in output at the Kamoa-Kakula mining complex in the Democratic Republic of Congo.
Copper smelters in China have pledged to curb output in response to a tightening copper ore market and following a collapse in spot treatment and refining charges to record lows. Spot charges in China plunged to $2.30/t last week, according to weekly data from Fastmarkets. They are now down more than 95% since the beginning of the year.
The drop in treatment charges reflects not only the tightening concentrates market but also the rapid expansion in copper smelter capacities in China. China’s strategic need for copper has driven this expansion as demand from the green energy sector continues to grow. Last year, China’s production of refined copper surged 13.5% year-on-year to 12.99 million tonnes, according to data from the National Bureau of Statistics (NBS (LON:NBS)).
The global refined copper market was expected to be fairly balanced this year, but the shortfall in mine supply now means that the market is likely to be in a deficit. The extent of this deficit will also depend on the scope of Chinese smelters' production curbs and how quickly Chinese copper demand will pick up in the second quarter, which is seasonally the strongest for copper demand.
Hopes for a global recovery in demand this year are also supporting copper, with manufacturing activity picking up globally. In China, the official manufacturing purchasing managers’ index expanded in March for the first time since September.
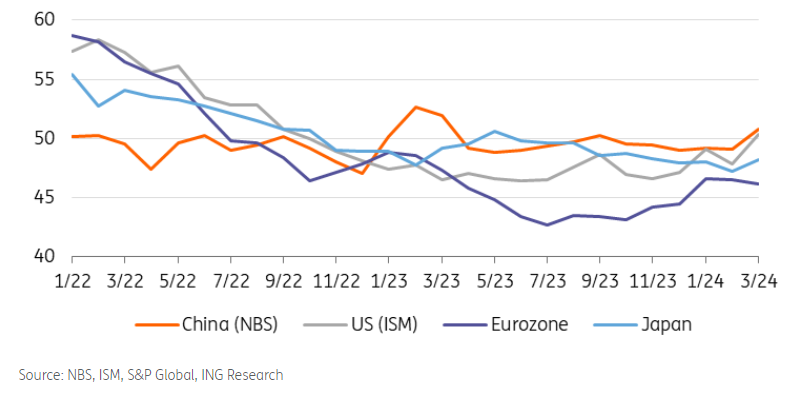
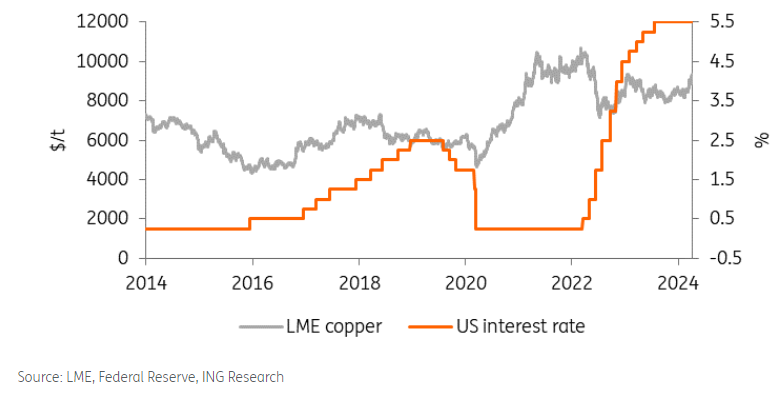
Copper prices have also been lifted by the nearing end of the Federal Reserve’s interest rate tightening cycle. Elevated rates and a stronger dollar have been a drag on industrial metals over the past two years.
Looking further ahead, copper prices will be supported by a weaker US dollar on the back of Fed easing. Copper will benefit from looser monetary policy, which will alleviate the financial strain on manufacturers and construction companies by reducing borrowing costs.
However, with the latest US jobs data for March surged past estimates, the prospect of a June rate cut from the Fed looks slim.
If US rates stay higher for longer, this would lead to a stronger US dollar and weaker investor sentiment, which in turn would translate to lower copper prices.
At the same time, demand uncertainties remain. China’s property market has been a major headwind for copper demand for the past year. A continued slowdown in the sector remains the main downside risk for the metal. However, while housing starts were down more than 20% last year, completions, the key source of copper consumption, have been rising. This could provide additional support for copper prices in the future.
In the short term, the upside to copper prices might be capped by macro drivers, including ongoing demand concerns in China and lingering uncertainty over US monetary policy.
However, micro dynamics are starting to look more constructive for the metal amid a tightening supply outlook. We see copper prices rising in the second quarter, which is seasonally the strongest for copper demand, to $9,050/t on average from an average of $8,539/t in the first. They could peak in the fourth quarter at $9,100/t. That said, the market will remain volatile as it's exposed to macro drivers, not least from US interest rates and Chinese policies.

