
- A low CPI will lower outlook for rate hikes
- Polls have Republicans in lead; Democratic surprise win will raise fears of more spending
- Last week, yield curve inverted the most in 40 years
Two catalyst-making themes next week could revive the weakening equity advance or finish it off.
Friday's mixed jobs data allowed dip buyers to help bulls save face at the end of November's first week, which saw a decline in each session. After a weekly decline of 5.25%, traders felt the bargain was worth the risk a day after Fed Chair Jerome Powell may have hinted at tamer future increases vs. the past four straight 75-basis-point hikes. These have brought the fed funds rate to a target range of 3.75% to 4%, reflecting the sharpest increase imposed since the 1980s.
Stocks surged on Thursday when Powell opened the possibility that the Fed may taper increases, but the market sold off after he clarified that the bank would not stop until it controlled inflation.
Wall Street's volatility contract, referred to as the "fear gauge," shows fear is still in the mix.

Source: Investing.com
Even after the drop since the October highs, corresponding to last month's low in equities, the VIX is still near 25.00. Except for the 2008 and 2020 crashes, the gauge has always been below these levels.
I have repeatedly warned you not to be impressed with the rallies we've seen, as they are merely corrections within a bear market. However, given the historic monetary changes, we see equally historic equity swings. In either direction, the S&P 500 has already provided five-month moves greater than 7% this year. Such powerful moves are rare. The last time it happened was following the 2008 crisis, and the time before that was 1933.
According to bulls, even if stocks are bottoming, it will be a wild ride. However, there is no evidence of a bottom, and we have received a signal of a continued downtrend.
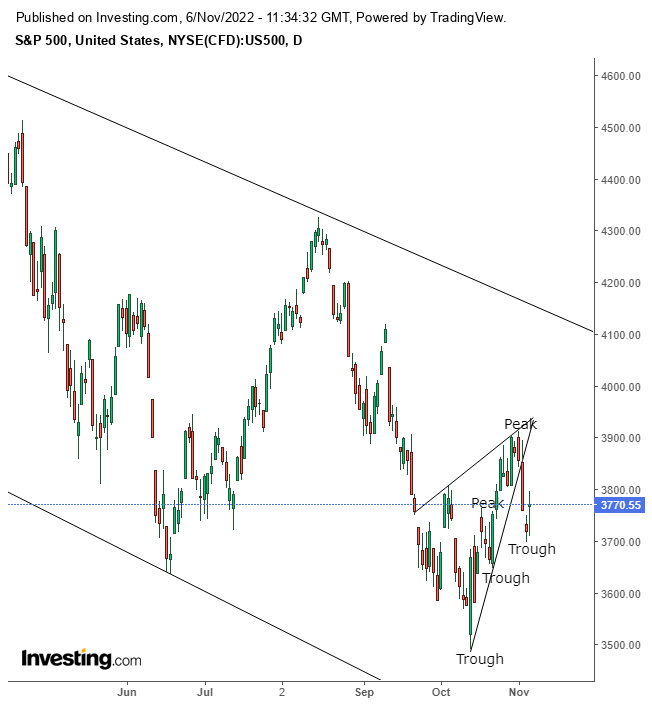
Source: Investing.com
The S&P 500 Index has been registering rising peaks and troughs in the short term while still falling in the medium term. However, the gauge completed a rising wedge on Wednesday. This pattern is a triangle with a steeper lower trendline, projecting the overeager behavior of buyers. However, the highs presenting to sellers didn't see the index rise as steeply as the lows did, so buyers gave up, allowing the index to fall below the pattern. This downside breakout is presumed to have set off a technical chain reaction in which triggered shorts and closed longs will push the stock further downward, reaching my 3,200 target from July 20 and maybe even my Aug. 25 target of 3,000.
Investors will keep a weathered eye on Thursday's CPI report after September's data beat estimates, rising to a 40-year high. Investors need to understand that even if the CPI eases, it's still well beyond the Fed's acceptable level. This Fed may be unwilling to rest on their laurels and see where inflation goes after having fallen behind last year.
Wells Fargo expects the Fed's terminal rate - the level at which the bank is likely to stop increasing rates - will drop 12 basis points if the CPI is below 0.4%. A Reuters survey estimates a 0.5% monthly rise.
On the political front, an unexpected Democratic victory in the Nov. 8 midterm election could worry investors that the Democratic-controlled Congress will further increase fiscal spending, fueling further inflation.
The Democrats are on the back foot: Polls show Republicans in the lead and on track to split power with the Democrats. Republicans are predicted to take control of the House of Representatives, and maybe even the Senate, for the second half of President Joe Biden's term.
The yield-curve inversion reached last week was the most extreme one seen since the 1980s, flashing a recession all the brighter.

Source: Investing.com
On Thursday, the 2-year note yield rose above the 10-year note by 58.6 basis points, the highest spread in forty years. The inversion eased Friday, corresponding to the reduction of fear seen in rising equities and the declining VIX.
The dollar sold off 1.8%, making for its steepest drop of the year, aligned with the theme that the Fed may ease its interest rate increases, which drove stocks higher on Friday.

Source: Investing.com
From a technical standpoint, the dollar extended its falling wedge pattern as it revisits its uptrend line.
The inverted yield curve is seen as bullish for gold, which soared from a monthly low after investors increased hopes for a hike slowdown. However, the assumption that gold will rise with a recession is that the Fed will lower interest rates to get out of the recession - but that is in the long term. For now, I am bearish on gold.

Gold's surge is merely a return move to a gigantic double top. Note how the neckline resisted the price, which closed precisely below it.
Disclosure: At the time of publication, the author had no positions in the securities mentioned.