US corporate share buybacks are on the rise. A company typically returns profits to shareholders in one of two ways—either via a dividend payout or a share buyback. Typically after a stock buybacks, an investor owns the same number of shares, but now with fewer shares available, the value of each share should rise.
If management believes the shares are undervalued, the company board might authorize a repurchase schedule. Typically, when a company announces an upcoming stock buyback program, its share price usually rises. Legendary investor Warren Buffett regards stock buybacks as one of the best uses of corporate capital. He has regularly bought back shares of Berkshire Hathaway (NYSE:BRKa) (NYSE:BRKb).
On the other hand, recent research by Sirio Aramonte of the Bank for International Settlements (BIS) in Basel, Switzerland, points out:
“Managers could use [share buybacks] to artificially increase stock prices in order to boost performance pay…. Between 2010 and 2019, US firms distributed $4 trillion in dividends and $6 trillion in buybacks.”
The S&P 500® Buyback Index measures the performance of the top 100 stocks with the highest buyback ratios in the S&P 500. In the past year, it is up more than 68%.
According to recent metrics from S&P Global (NYSE:SPGI):
“Q4 2020 share repurchases were $130.5 billion, rebounding 28.2% from Q3 2020's $101.8 billion… Buybacks are expected to significantly increase in 2021, as big banks, via Fed approval for Q1 2021, have returned to the buyback market and more companies continue to look to negate stock options.”
The debate on the merits and consequences of share repurchase is likely to continue in the coming quarters. However, most investors typically like stock buybacks. Therefore, today we introduce an exchange-traded fund (ETF) that could appeal to readers looking to invest in companies that acquire their own shares.
Invesco BuyBack Achievers ETF
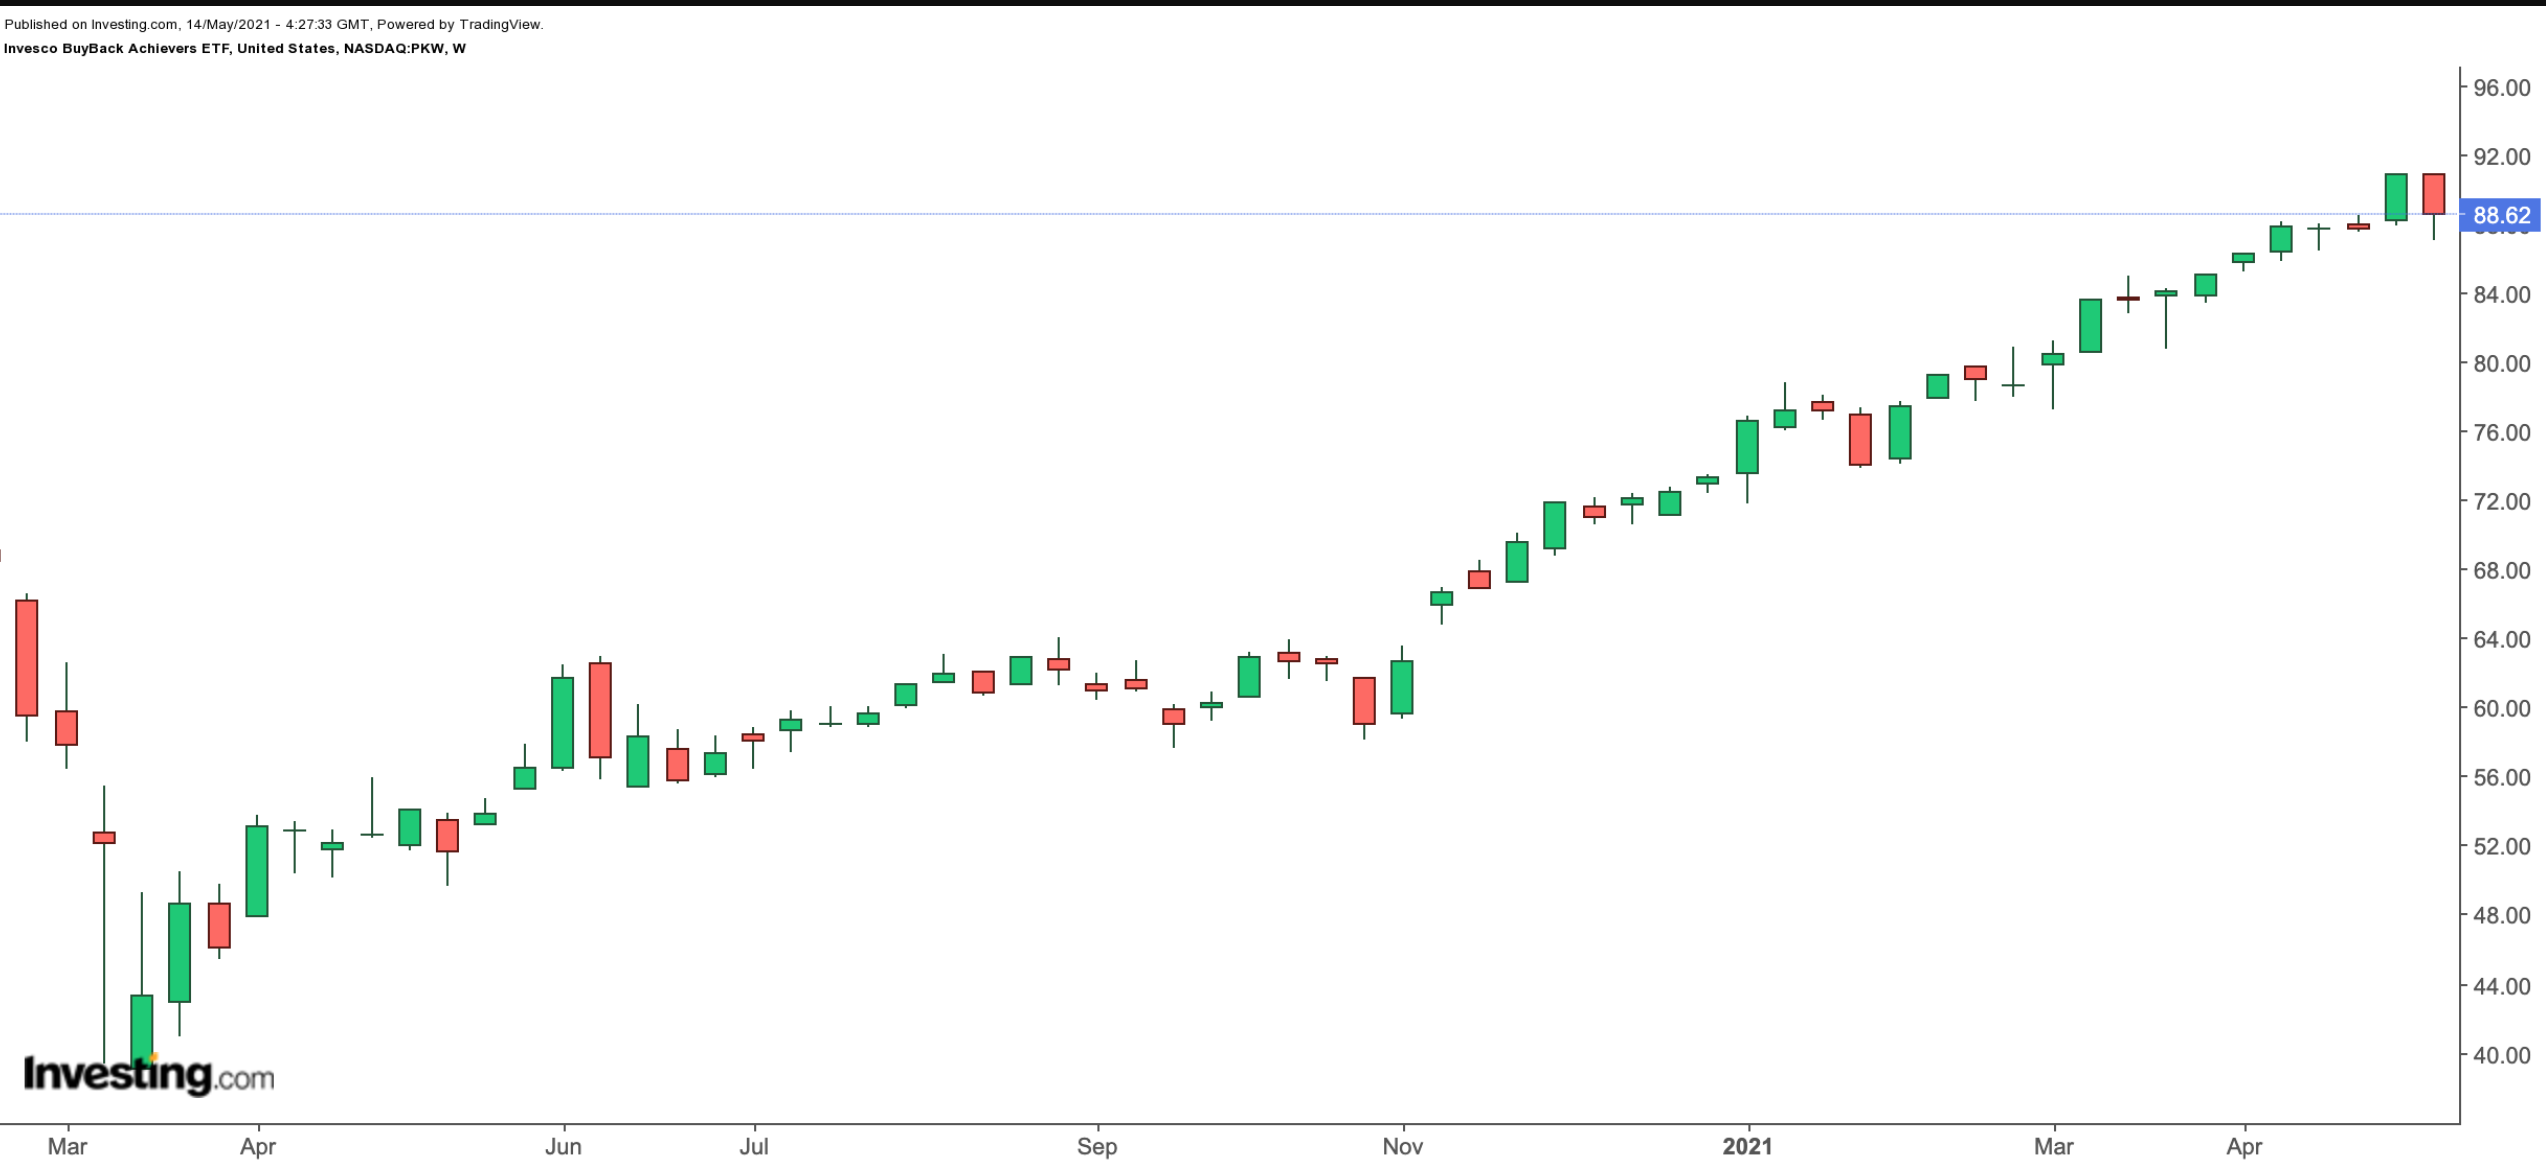
Current Price: $88.62
52-Week Range: $49.64 - $91.82
Dividend Yield: 1.13%
Expense Ratio: 0.62% per year
The Invesco BuyBack Achievers ETF (NASDAQ:PKW) gives access to businesses that have reduced their share count by at least 5% in the past year. Since its inception in December 2006, net assets have reached almost $2 billion.

PKW, which has 109 holdings, tracks the returns the NASDAQ US BuyBack Achievers™ Index. In terms of sectoral breakdown, financials has the highest share with 28.36%, followed by information technology (24.04%) and health care (12.74%).
The top 10 names comprise about 45% of the fund. Among the leading names are Charter Communications (NASDAQ:CHTR), Oracle (NYSE:ORCL), Allstate (NYSE:ALL), HP (NYSE:HPQ), Biogen (NASDAQ:BIIB), eBay (NASDAQ:EBAY), Intel (NASDAQ:INTC), Fortinet (NASDAQ:FTNT), McKesson (NYSE:MCK) and Ameriprise Financial (NYSE:AMP.
Since the start of the year, PKW is up more than 20% and hit a record high on May 10. We like the diversity of sectors and the quality of the companies in the fund.
However, the index strategy is backward looking on share buybacks. In other words, there is a timing lag. Thus, one could argue that it is hard to conclude whether the level of recent returns is due to the overall market strength or due to share buybacks.
Given the current volatility in the markets, there could be some profit-taking in several of the names that make up the ETF. Interested readers would find better value around $85 or even below. For now, we would keep PKW on our radar.
On a final note, those investors interested in global businesses that buy back their own shares might also want to research the Invesco International BuyBack Achievers™ ETF (NASDAQ:IPKW). IPKW The fund started trading in February 2014, and has about $129 million in net assets.
In terms of country allocation, Japan leads with a 28.77% slice, followed by Canada (23.51%) and the UK (9.02%). Year-to-date, the IPKW has returned more than 14%, and hit an all-time high of $46.21 on May 10.
