Market Overview
Even though Wall Street is once more moving on with an outlook through rose tinted glasses, traders on major forex markets continue to hug a cautious line. Treasury Secretary Steve Mnuchin suggested yesterday that they were “very confident” that phase one of a trade agreement with China would be signed in January. However, outside the bubble of Wall Street, markets seem to be far more cautious and seem to need more assurance. US Treasury yields are showing a marginal steepening of the curve but in essence, moves are still very muted. This is being reflected across recent moves in forex majors, where perhaps even a risk retreat is being seen as the Japanese yen claws back some recent losses and the Swiss franc is also performing better. Perhaps new that the United States, Mexico, Canada Agreement (USMCA) being signed helped to boost sentiment on equity markets, with Wall Street pulling further all-time highs again, but this enthusiasm is not being reflected everywhere (with Asian markets and European futures cautiously lower). Although oil is still drifting higher, gold continues to remain supported and bump up against $1480.
The suggestion that UK Prime Minister Johnson will play hardball over the Brexit transition period is weighing on sterling (on course for its worst week in years) and dragging the euro back too. There are a few economic data announcements today to tie up which may distract from the macro picture, but as we move towards the end of the year, there is still limited decisive direction on forex majors.
Wall Street closed in all-time highs again with the S&P 500 +0.4% at 3205. With US futures all but flat Asian markets were marginally lower with the Nikkei -0.2% and Shanghai Composite -0.4%. In Europe, markets are following similar moves, with FTSE futures -0.2% and DAX futures -0.1%.
In forex, there is little real direction although there is the slightest safe haven bias with JPY marginal gains and a shade of USD strength too.
In commodities, the theme is also one of consolidation where gold is trading around the flat line, whilst oil is also flat.
There are a few important data points to end the last full week on the economic calendar for 2019. The UK Current Account for Q3 at 09:30 GMT is expected to show an improvement I the deficit to -£16.0bn (from -£25.2bn in Q2). The UK final Q3 GDP is t 0930GMT and is expected to show no change on the second reading at +0.3% for the quarter (after -0.2% in Q2).
The US final Q3 GDP is at 1330GMT and is expected to be confirmed at an annualised +2.1% (after +2.0% in Q2). US Core Personal Consumption Expenditure at 15:00 GMT is expected to remain at +1.6% in November (+1.6% in October). The revised Michigan Sentiment for December is expected to show confirmation of 99.2 (which would be up from the final 96.8 in November), with the Michigan Current Conditions to be confirmed at 115.6 and the Expectations component at confirmed at 89.7.
Chart of the Day – USD/CHF
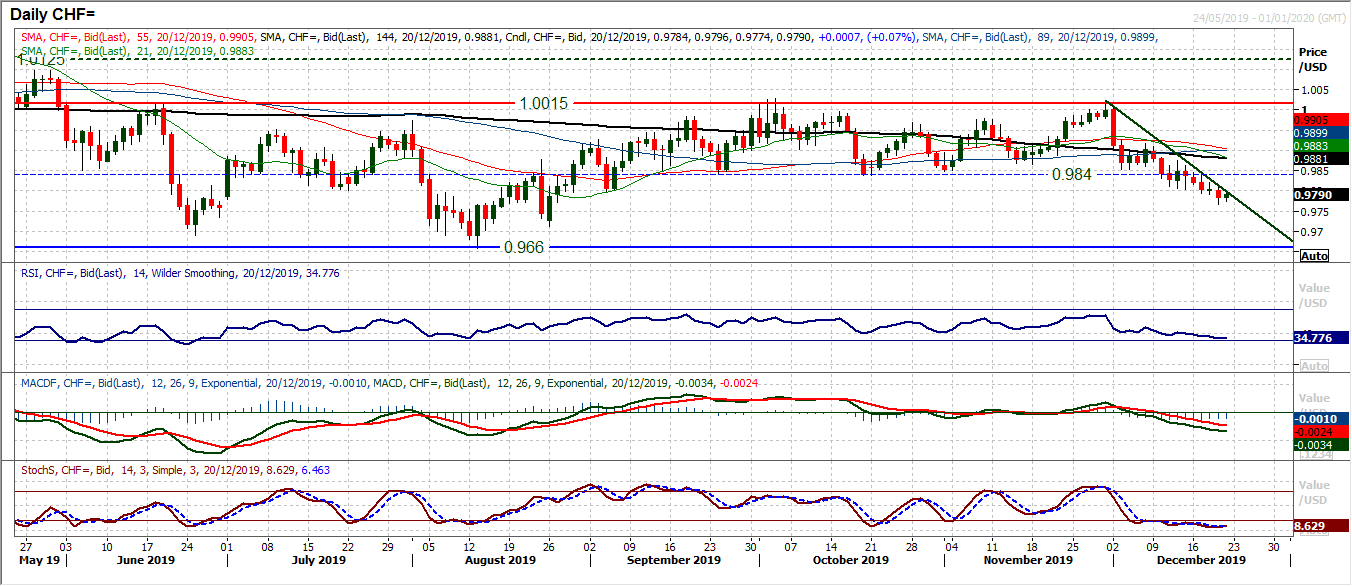
We previously looked at the US dollar under pressure within a multi-month range against the Canadian dollar. However, the US dollar is also under pressure within a multi-month range against the Swiss franc. Since June the market has been in a c. 350 pip range between 0.9660 and 1.0015, but the loss of the key mid-range pivot support at 0.9840 has been a key move in the past week. The formation of a three week downtrend with a series of negative candles where intraday rallies are consistently being sold into is leading the market lower. Momentum indicators confirm the breakdown, with the RSI falling to a four month low, MACD lines falling below neutral at a four month low and an outlook that suggests that rallies will continue to fade. A move back to test initial support at 0.9710 and the key August low at 0.9660 is growing increasingly likely now. The pivot at 0.9840 has become a basis of resistance through this week, whilst the downtrend falls at 0.9800 today.
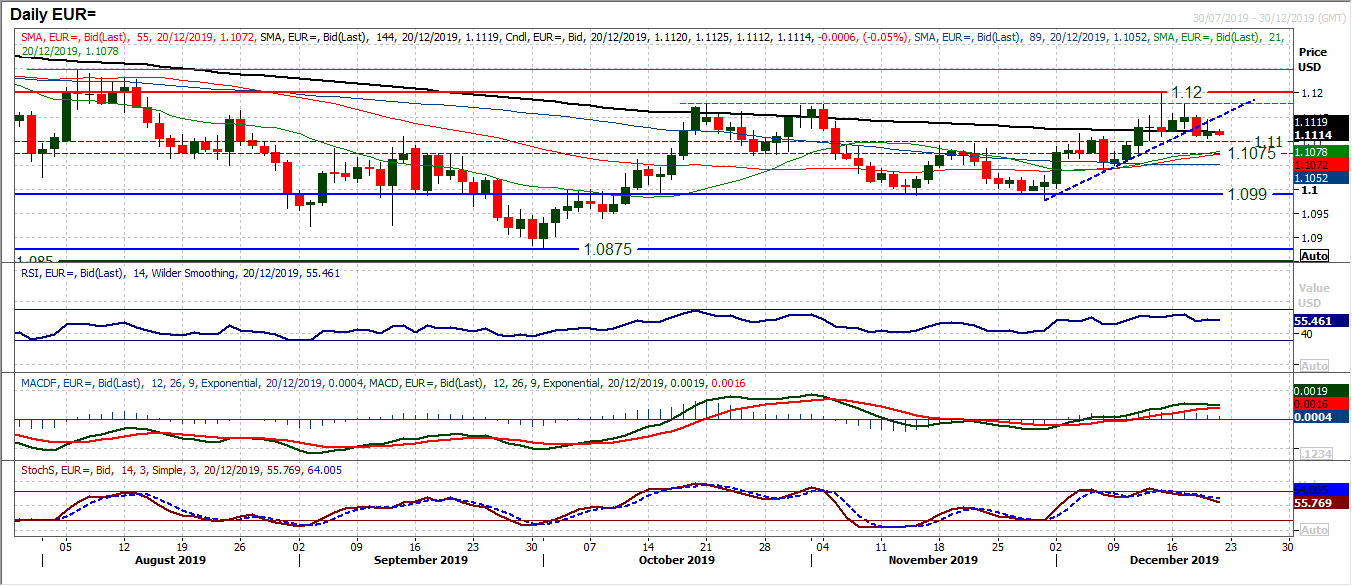
The bullish arguments have not disappeared, but are more muted now. An initial positive reaction to Wednesday’s decisive negative candle was subsequently sold into and only a marginal positive session resulted yesterday. The concern is that there is a growing sense of lower highs forming and pressure is mounting on the support $1.1100/$1.1110. We have seen that the momentum indicators have, at the least, lost their sparkle and are beginning to slip back. However, for now this is still just an unwind, rather than a growing correction. The key will be the response around the $1.1100 mid-range pivot. Pressure is seemingly mounting on the support. The market has been trading within a band $1.0980/$1.1200 for two months now, and a close under $1.1100 would be a signal for another retreat back towards the bottom of the band again. The hourly chart shows that yesterday’s high of $1.1145 is initial resistance now to breach and re-open the $1.1200 high again.
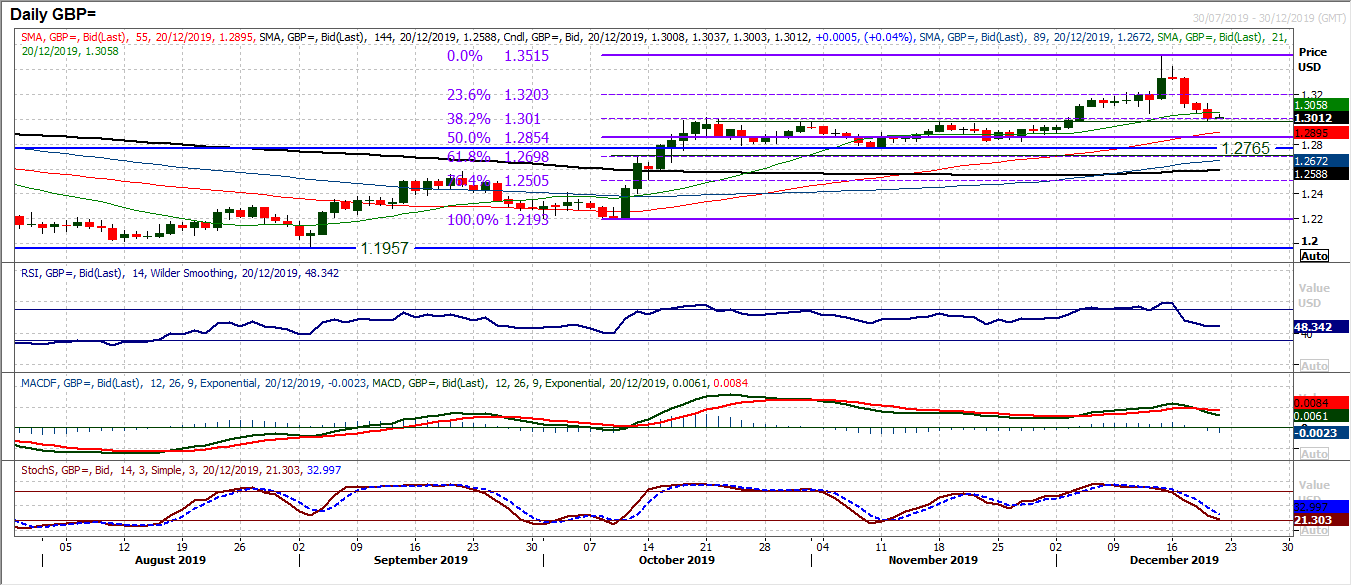
The retracement on Cable over the past few sessions has been considerable. A move back from $1.3515 has lost over 500 pips and the decline this week alone is one of the biggest in years. It is interesting to see the move back to the breakout around $1.3000. Throughout October into November the market was restricted around $1.2975/$1.3010 and this is now a basis of support. There is also the 38.2% Fibonacci retracement (of $1.2193/$1.3515) at $1.3010. This is a potential consolidation point for this correction. A decisive closing breach of the 38.2% Fib would open 50% Fib around $.12855. We have bee advocates of using this correction as a buying opportunity. However, if the 38.2% Fib level is decisively breached then we may need to reassess this view. Momentum indicators are at key levels with the RSI around 50. We see this as a key crossroads moment for Cable. Hold this support with momentum and the outlook will remain positive. A breach would continue the correction. Resistance at $1.3050/$1.3130.
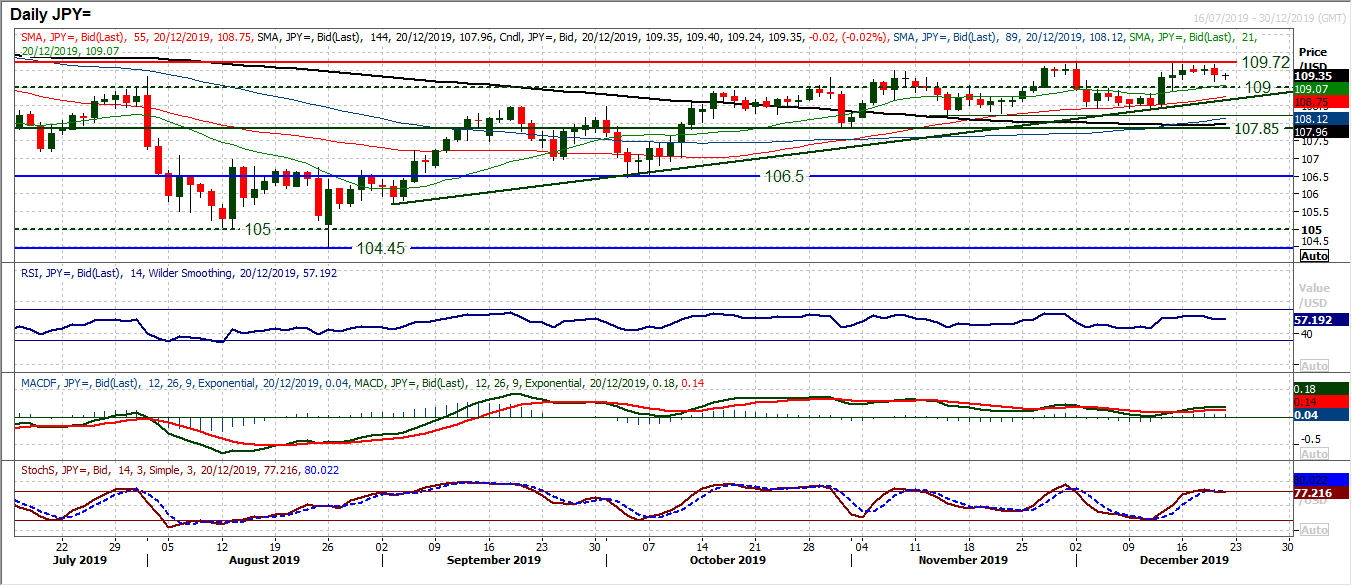
Our concerns for the rally on Dollar/Yen have been building in recent days. The resistance has been growing at 109.70 and the near term support at 109.40 has now been breached. A bearish outside day session with a decisive negative candle now open the likelihood of yet another retracement within the run higher. Momentum indicators have been struggling for traction in recent sessions and now following yesterday’s decline, the RSI is backing below 60, and Stochastics looking for a bear cross. There is a shallow uptrend since early September that comes in at 108.65 today and the rising 55 day moving average which is a basis of support on recent corrections at 108.75 today. Given the way that Dollar/Yen will tend to retrace breakouts in recent months, a retreat back towards the 109.00 breakout is now likely.
Gold
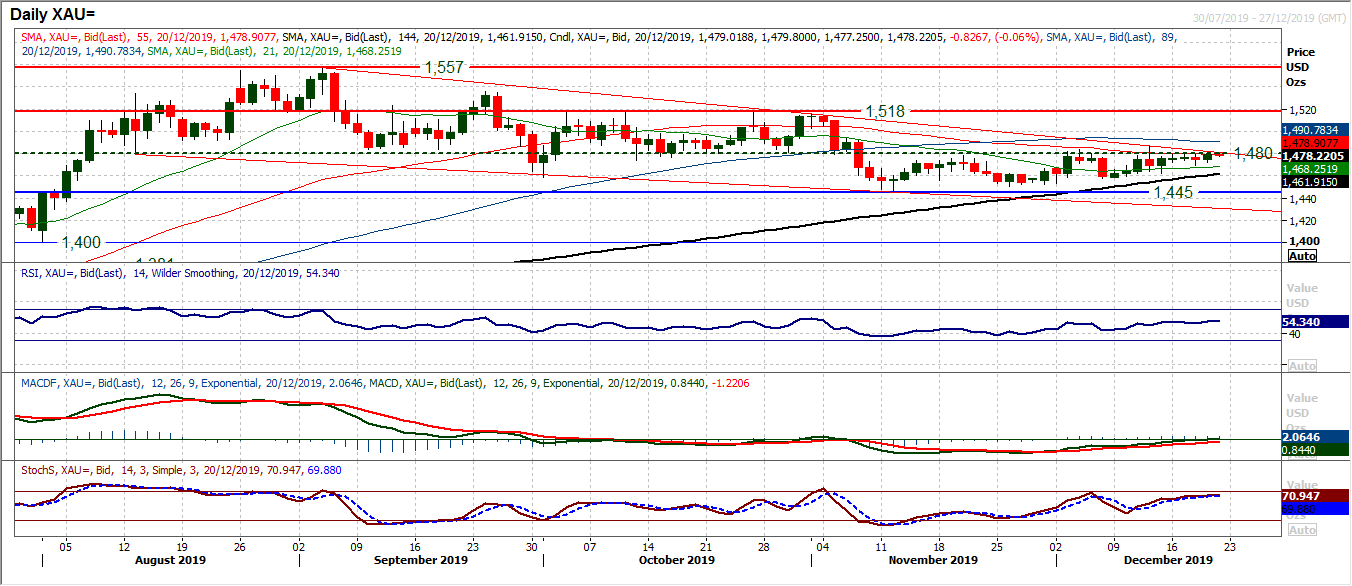
Yet another session of testing the resistance around $1480 but as yet no move of conviction. Extremely tight daily ranges (just $9 yesterday again below the Average True range of $12), along with small candle bodies all playing out under the key medium term resistance at $1480 means that this is an indecisive market. A marginally positive candle continues to ask questions of the old stale bulls (from August to October) around the overhead supply of $1480, but we are mindful that repeatedly the market has failed to rally decisively through this resistance. Once more coming into the European session there is a lack of conviction. The downtrend channel resistance at $1481 adds to the barrier to recovery. Momentum indicators are flattening their improvements, a shade above neutral configuration, means that this is a market in need of direction. A close above $1487 would open the upside, but for now this remains a deeply frustrating market. Initial support at $1470 and the hourly chart shows a pivot support around $1465.
WTI Oil
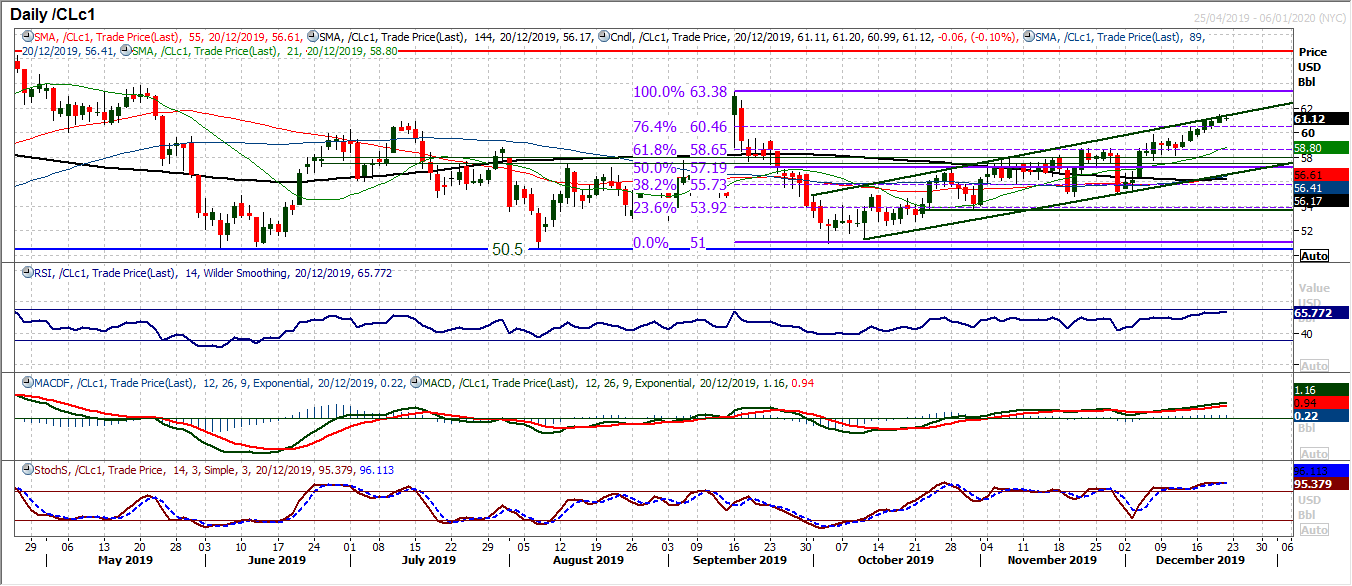
The market continues to trade higher, pulled along by the top of the uptrend channel. Momentum is strong with the RSI in the mid-60s, MACD lines at multi-month highs and Stochastics strongly configured. With the market trading decisively clear of the 76.4% Fibonacci retracement (of $63.40/$51.00) at $60.45 opens a full retracement target of $63.40, for which there is almost no resistance to. Given the strength of momentum with upside potential and run of positive candles, we are happy to back the move higher. If there were to be a correction, we would see it as an unwinding move within the uptrend channel and look to buy into support. There is strong support now $57.85/$58.65.
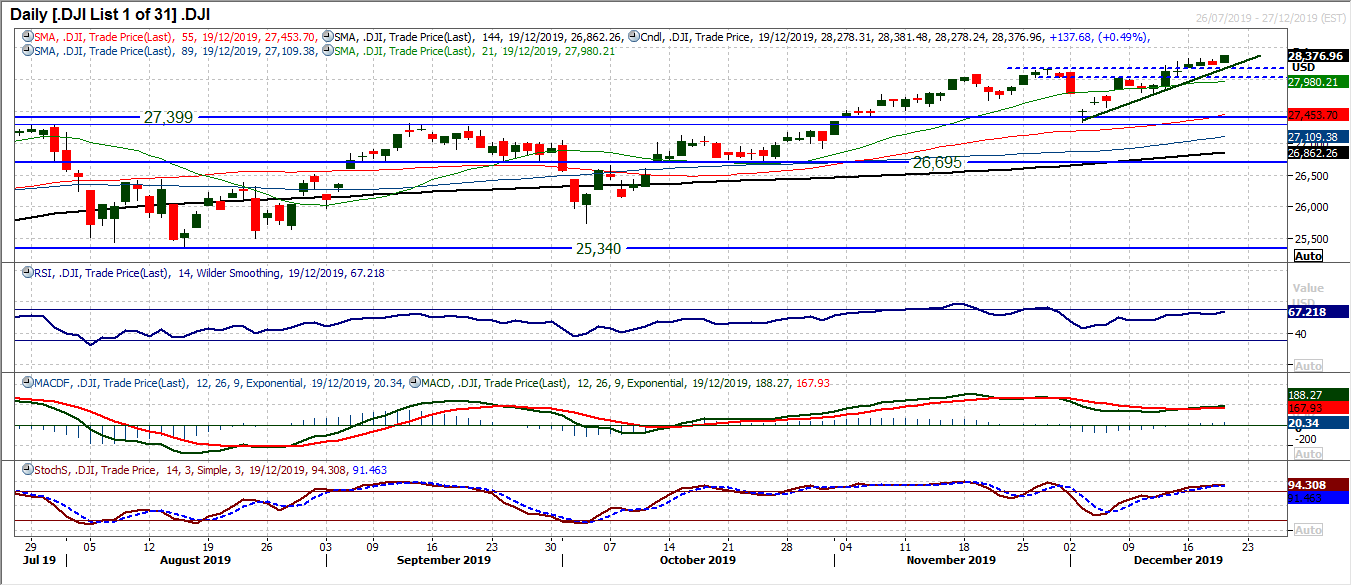
We have been positive on the Dow for a while now, confident of a buy into weakness strategy, and backed by the market breaking new all time highs in recent weeks. We have been more cautious recently due to a run of rather cautious candles, which had led to us suggesting another near term corrective move could have been brewing. However, news of progress towards signing the phase one trade deal and USMCA helped positive sentiment come back in again. The bulls have once more proven to be a sturdy bunch with yesterday’s latest breakout. A solid positive candle, closing in all-time highs once more. This is a market still driven by a positive configuration on momentum, but also upside potential with RSI in high 60s (tends to go into the lows 70s on bull legs), whilst Stochastics are also strong. We continue to see the breakout support 28,035/28,175 as supportive, whilst the support at 27,800 is key. We buy into intraday weakness.
"""DISCLAIMER: This report does not constitute personal investment advice, nor does it take into account the individual financial circumstances or objectives of the clients who receive it. All information and research produced by Hantec Markets is intended to be general in nature; it does not constitute a recommendation or offer for the purchase or sale of any financial instrument, nor should it be construed as such.
All of the views or suggestions within this report are those solely and exclusively of the author, and accurately reflect his personal views about any and all of the subject instruments and are presented to the best of the author’s knowledge. Any person relying on this report to undertake trading does so entirely at his/her own risk and Hantec Markets does not accept any liability. """
