Why is it that oil is falling on fears that a prolonged trade war would hurt demand, while equities are advancing on hopes of an improved trade relationship between the U.S. and China?
Oil traders are sitting on the sidelines, waiting to be smarter about the prospects of demand for oil after the Trump-Xi meeting during the G20 summit Saturday in Osaka, Japan. If things go south, so will demand for oil, followed immediately by prices.
If President Donald Trump follows through with his threat to levy duties on all remaining Chinese goods worth $ 300 billion, China will be incentivized to devalue the yuan to compensate for the tariffs and loss of business with the U.S. due to the blacklisting of Chinese companies, which Trump intimated yesterday. The devalued yuan would render dollar-denominated oil more expensive, hitting demand.
OPEC has been delaying a production management meeting till after the U.S.-China meeting for the same reason, to manage the price accordingly to maintain market share. To clarify, it will be in OPEC’s interest to keep a lid on prices.
The fear of falling demand is so powerful that it's overshadowed the lowest U.S. inventory release in 3 years. This has led to something rarely seen: the same market themes driving opposing reactions within different markets. Equity traders see hope in the reported tentative tariff ceasefire, while oil players need further proof that the U.S.-Sino relationship is improving.
Technicals, on the other hand show a clear corroboration between supply and demand forces.

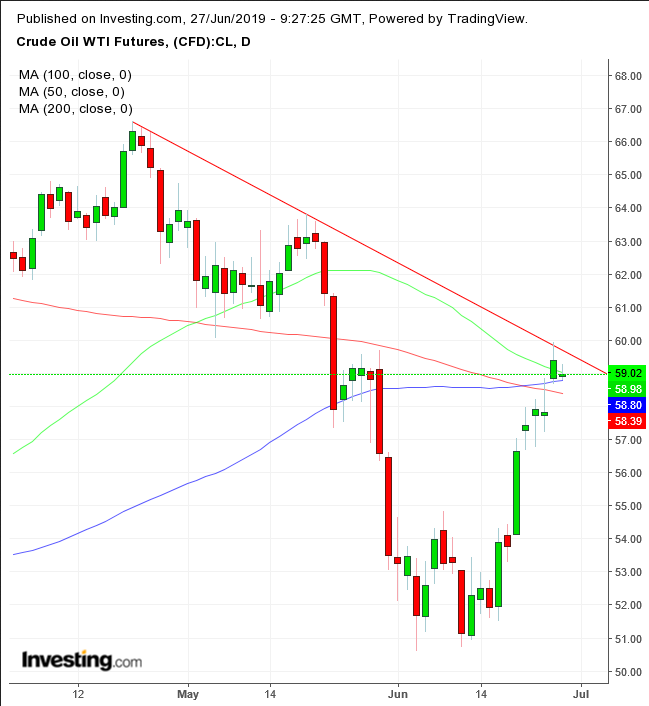
Falling U.S. inventories and U.S.-Iran tensions helped oil bounce as much as 15%. On Wednesday, the price stuck its neck over the downtrend line since the April 23 high, saw the $60 key level and put its head back down, closing well off the highs.
The dual resistance of the round psychological number and the medium-term downtrend line proved to be either a space for waiting supply or a self-fulfilling prophecy: traders, concerned about oversupply, moved quickly to beat it, thereby creating it themselves. In effect, it was likely a combination of the two. The rationale, of course, is the fundamental outlook.
While the price managed to not just cross, but leap over both the 100 and 200 DMAs, the 50 DMA has been taken in by the downtrend line’s slump — coming closest to it since crossing above it in early May, threatening a Death Cross, the most infamous technical indicator to non-professional technicians.
The price is likely to trade tightly between the downtrend line and the 200 DMA till Saturday. Unless, of course, Trump takes to Twitter.
Trading Strategies
Conservative traders would short after the price falls below the 200 DMA while forming a descending series of short term peaks and troughs; alternatively, they'd go long after beating the April high.
Moderate traders would be content with evidence of the medium-term downtrend's resumption with a close below the 200 DMA, preferably including evidence of resistance when retesting the 200 DMA from below, with at least one long red candle engulfing a green or small candle of either color.
Aggressive traders may short at will after drawing up a plan that fits their budget.
Trade Sample 1: Longer Duration
- Entry: $59
- Stop-Loss: $60
- Risk: $1
- Target: $56
- Reward: $3
- Risk-Reward Ratio: 1:3
Trade Sample 2: Shorter Duration
- Entry: $59.25, below today’s high
- Stop-Loss: $59.40, yesterday’s closing price
- Risk: $0.15
- Target: $58.80
- Reward: $0.45
- Risk-Reward Ratio: 1:3
