It’s suddenly risk-on last week with the battered-down Nasdaq climbing 8% from its bear market low on 6 January. And this sudden change of heart has the MSM in a tizzy with flights of fancy projecting a new bull market. It always amazes me what a bear market correction can do to the imagination.
For perspective, the multi-generation share bull market – which I have named the Great Asset Mania (GAM) – has taught investors to Buy The Dip since shares always go up. But as I said at the time a year ago, that game was over. The new game was and is Sell The Bounce.
And that strategy has been paying off well all of last year. All markets are down from their ATHs (except the incredible LVMH (EPA:LVMH) luxury firm).
But memories of former glories when Tesla and Bitcoin (the poster children of the GAM) rocketed to the moon persist (they are both down over 70% which has destroyed the Buy and Hold strategies that worked so well until a year ago). And they will be hard to dislodge – but they will when the next leg of the bear market appears.
The immediate trigger for the rally was attributed to the famous US CPI print on Thursday. While it confirmed what we are all seeing in the real world that price inflation is easing, could it be that we now have a Buy the Rumour, Sell the Event opportunity?
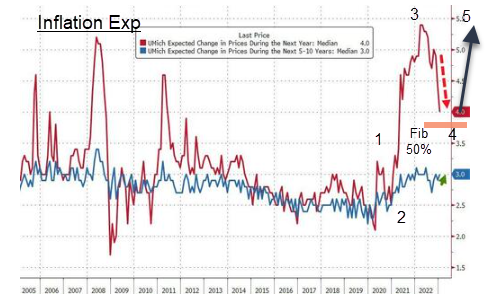
Here is an interesting chart of the well-respected U Michigan Inflation Expectations

Because this is a survey of a cross-section of US society, we can apply the Elliott wave principle to the results. It reflects the changes in sentiment towards future inflation, just as a stock price does the same to future expectations of stock prices.
The shape of the red line off the 2020 low (when interest rates were near zero) suggests the surge in 2021/2022 is a third wave and the current correction is wave 4 which is now close to the Fib 50% support. And because commodity prices appear to be back in rally mode after deep corrections (see crude oil below), I expect this lagged data to show a turn back up in the coming months when consumers note the rising gas/fuel prices at the pumps.
This is an ideal setup for a massive turn in shares ahead. And I have Great Expectations for a renewed surge in inflation.
The MSM is full of rationalizations of why the bear is over from expectations the Fed will now ease up on rate hikes with lower inflation to low risk-on positioning by the funds who need to catch the FOMO bug again.
Yes, all risk-on markets rose last week from gold to bonds to currencies (especially the yen!) to Bitcoin – and even Tesla rose a tad. In fact, I anticipated this bounce with several buy advices earlier.
So the S&P rally has resulted in the VIX Fear Index plumbing new depths as fear was drained from the system and now complacency reigns again. In fact, bearish expectations for the VIX have reached an extreme 88% DSI reading – a level last seen at previous stock market highs. Hmm.
So with that extreme data point and stock indexes still way below previous highs of last year, the failure to reach new highs with such high bullish confidence is telling me one thing – the bear market correction is about over – but it may last a little while longer yet.
Why? Simply because the next FOMC meeting is on the 25th of January and investors will be jockeying for position ahead now convinced the Fed will raise by only 25 bps. They will knee-jerk take that as a strong buy signal,
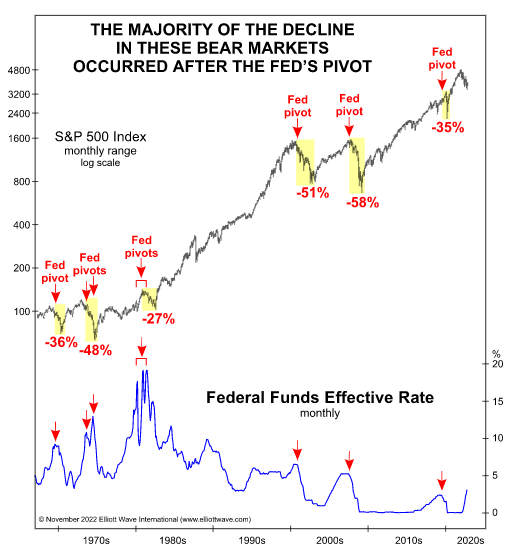
But if the Fed does that, they would do a pivot. And I have shown what happens when all previous Fed pivots have been applied – shares have topped and entered large bear phases.

From a sentiment perspective, this is perfectly understandable. The excitement leading up to a well-flagged pivot creates a hugely overbought market where the bears sell into an open door. Profit selling turns into cascades as the buyers disappear and third waves appear.
I am preparing for a massive turn lower in third waves.
Is timing everything?
It’s an old cliche that timing is everything (in life). In trading the financial markets, while that is not accurately true, if your timing is even slightly off – despite guessing the correct direction – you lose money in leveraged trading. And that defeats the objective does it not?
That sets the aspect of timing as of critical importance – and that is why I spend so much effort in locating not only the next direction of travel but also a suitable low-risk trade entry.
Of course, some traders use ‘gut feel’ as their timing tool. But that usually coincides with the herd’s feelings. If you are feeling bullish, then take it that you are not alone. After a market has rallied for a while, most do feel bullish. I know I do! It is normal human nature to expect an ‘established’ trend to continue,
But it is one thing to feel bullish – and act on it by buying – and another to feel bullish and look to sell.
That is what successful pro traders do – we are always looking for reasons to go against the herd.
And those reasons can be found in an analysis of the price charts – and a take on current sentiment/mood.
What I am looking for is a likely exhaustion of a trend that can be signaled by the technical indicators that I follow – and a reading of extreme sentiment.
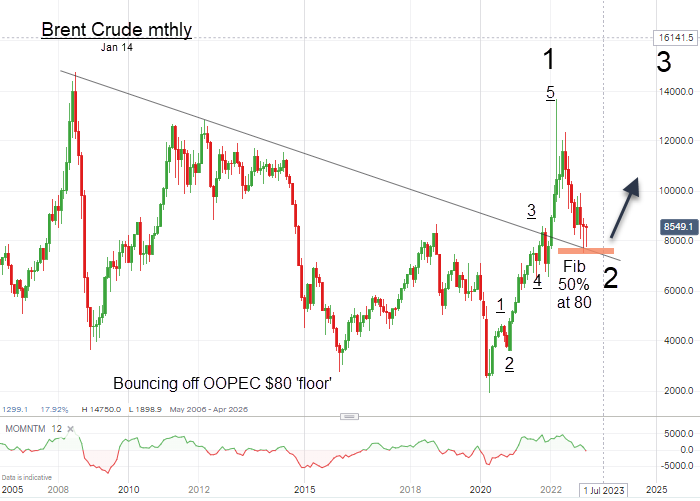
Here is a great example in real-time – crude oil. Energy markets have been in deep corrections in recent weeks and the MSM has ready rationalizations for that. So much so that most expect energy prices to remain correcting for some time (trend continuation). But take a look at this long-term chart of Brent Crude – the most common internationally traded feedstock:

Yes, oil has been on a gigantic roller-coaster ride for many years with the latest bull run starting at the 2020 Corona Crash low (when spot crude was famously trading negatively!).
Then the gradual re-opening of economies put a rocket under prices and they spike topped (in five waves) to the $137 high last March. That was one heckuva ride – part of which we managed to capture for members.
But since then, prices have corrected but note to the Fib 50% area where they kissed the major trendline and now are in a Scalded Cat Bounce (see text pp 83 – 84, 143). And that area lies right at the $80 region which is the stated ‘floor’ that OPEC declared they would defend. The recent bounce tells me they are doing just that.
And if my projections for $200 or even $300 are correct -a likely scenario under some realistic conditions – the profit potential is huge – even better than in 2020 – 2022.
So how about timing this market? After all, get your entry wrong by a few $$s and you are promptly stopped out for a loss. And that knock may make you wary of getting back in – just when conditions are most suitable for buying the market.
That’s why you need to take a Free Trial to my VIP Traders Club and let me guide you through the many twists and turns of what should be our very exciting and potentially hugely profitable campaign.
Is Amazon (NASDAQ:AMZN) a buy?
Our favorite retailer has not been immune to last year’s share sell-off (aka re-rating) in Big Tech. The cost-of-living squeeze has put a dent in its business. And now it is shedding large swathes of workers. Some investors view this as positive as it cuts operating costs to help the bottom line.
But a ‘growth’ company that sheds jobs is hardly a sign of ‘growth’ Perhaps much like most of the other major US ‘growth’ companies such as Meta, Amazon has become a non-value share!
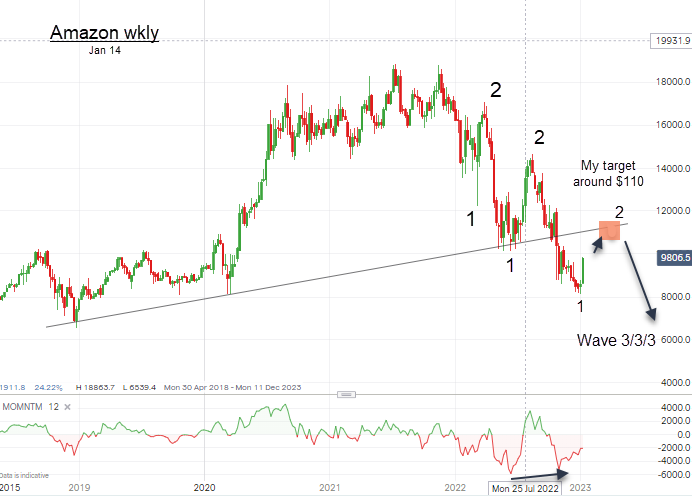
Here is my take on the way ahead:

From last year’s highs, the shares have declined to first touch the major trendline, bounce, and then break below it last October. It is now trying very hard to get back to the line. My projection is that it will use the period pre-FOMC on the 25th to go for it – and fail with perhaps a kiss first at my target area.
If my wave labels are correct, this failure and the subsequent Scalded Cat Bounce down should lead to a wave 3/3/3 down – the most destructive wave in the book. And only an unexpected move much above the trendline say above $120 would force a re-think.
Many are seeing decent short-term profits on shares I recently recommended for Pro Shares members. Now is the time to start looking to take those profits.
