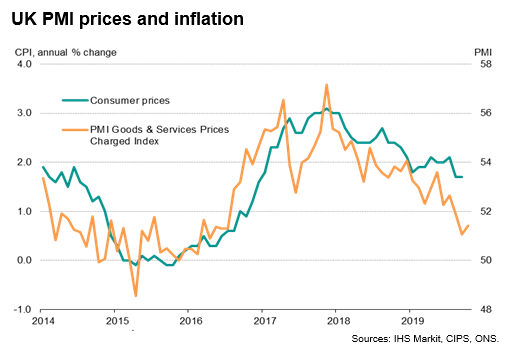
Price pressures meanwhile remained at their lowest for over three years. Average input costs showed the smallest monthly rise since June 2016, moderating in all three sectors, though to the greatest extent in manufactuiring, where lower commodity prices helped prevent costs from rising for the first time since March 2016.
Average prices charged for goods and services meanwhile showed the second-smallest monthly increase since July 2016, the rate of increase rising only modestly from September's recent low.
Looser policy bias
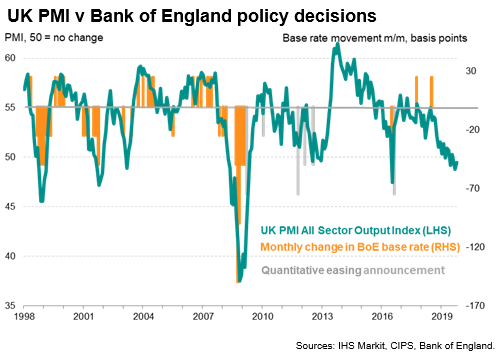
The ongoing decline signalled by the three surveys leaves the main PMI gauge of output deep in territory that would normally be associated with looser policy from the Bank of England, suggesting a greater likelihood of the next move in interest rates being a cut.
Such weak PMI readings as those seen in the third quarter have in fact never been seen before in over 20 years of PMI survey history in the absence of either recent or imminent stimulus, such as rate cuts or quantitative easing. Our expectation is that policymakers will once again sit on their hands at the next MPC meeting, choosing to delay any policy decisions amid the heightened political uncertainty emanating from the upcoming general election and the consequences for Brexit. However, the weak PMI readings suggest that the economy is deteriorating markedly as the Bank of England sits and waits for the Brexit fog to clear.
Disclaimer: The intellectual property rights to these data provided herein are owned by or licensed to Markit Economics Limited. Any unauthorised use, including but not limited to copying, distributing, transmitting or otherwise of any data appearing is not permitted without Markit’s prior consent. Markit shall not have any liability, duty or obligation for or relating to the content or information (“data”) contained herein, any errors, inaccuracies, omissions or delays in the data, or for any actions taken in reliance thereon.
In no event shall Markit be liable for any special, incidental, or consequential damages, arising out of the use of the data. Purchasing Managers' Index™ and PMI™ are either registered trademarks of Markit Economics Limited or licensed to Markit Economics Limited. Markit is a registered trade mark of Markit Group Limited.
The UK PMI surveys recorded a third successive monthly contraction of business activity in October, indicating the economy is in its toughest spell since early-2009.
The UK PMI surveys recorded a third successive monthly contraction of business activity in October, indicating the economy is in its toughest spell since early-2009.
Economy struggling to expand
Economy struggling to expand
The seasonally adjusted IHS Markit/CIPS 'all-sector' PMI rose from 48.8 in September to 49.5 in October, moving closer to the no-change level of 50.0 but nevertheless indicating a marginal contraction of output across the combined manufacturing, services and construction sectors. Declines have now been recorded in four of the past five months, marking the worst spell since 2009, during the global financial crisis.
The seasonally adjusted IHS Markit/CIPS 'all-sector' PMI rose from 48.8 in September to 49.5 in October, moving closer to the no-change level of 50.0 but nevertheless indicating a marginal contraction of output across the combined manufacturing, services and construction sectors. Declines have now been recorded in four of the past five months, marking the worst spell since 2009, during the global financial crisis.
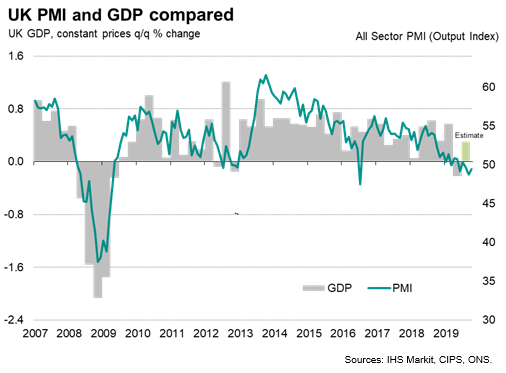

The October reading is historically consistent with GDP declining at a quarterly rate of 0.1%, similar to the rate of contraction of GDP signalled by the surveys in the third quarter. While official data are likely to have indicated more robust growth in the third quarter, the PMI warns that some of this strength reflects a pay-back from a steeper decline than signalled by the surveys in the second quarter, and that the underlying business trend remains one of stagnation at best.
The October reading is historically consistent with GDP declining at a quarterly rate of 0.1%, similar to the rate of contraction of GDP signalled by the surveys in the third quarter. While official data are likely to have indicated more robust growth in the third quarter, the PMI warns that some of this strength reflects a pay-back from a steeper decline than signalled by the surveys in the second quarter, and that the underlying business trend remains one of stagnation at best.
Broad-based malaise
Broad-based malaise
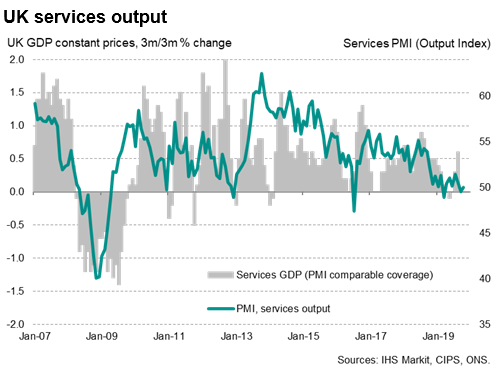
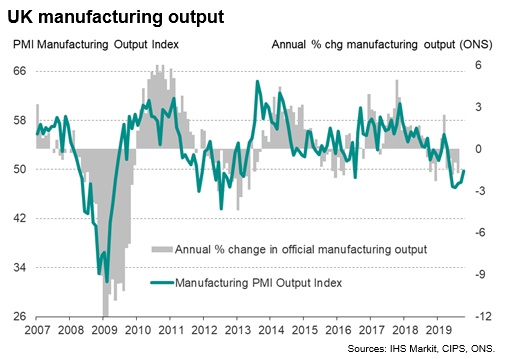
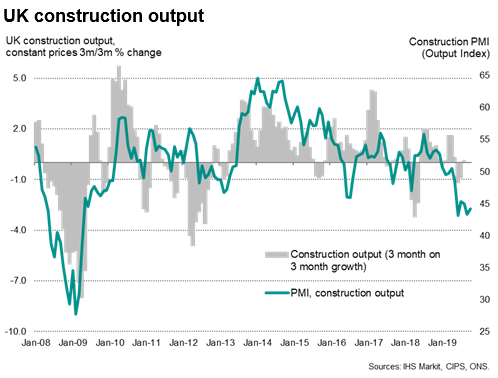
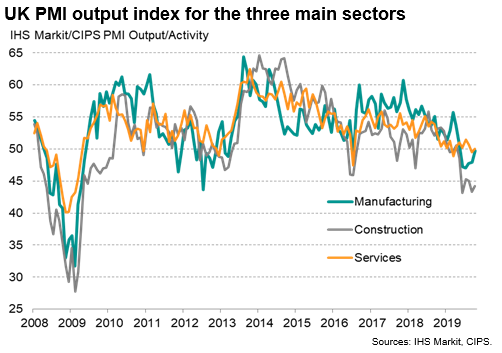
Output again fell especially sharply in the construction sector, with a far more modest decline seen in manufacturing, the latter seeing a notable moderation of its downturn. Despite the easing seen in October, manufacturing remains in its worst spell since 2012 while construction is in its deepest downturn since 2009, with both appearing to be in recession. Service sector activity meanwhile stagnated, improving on the decline seen in September but still suggesting that the sector is stuck in its worst patch since 2012.
Output again fell especially sharply in the construction sector, with a far more modest decline seen in manufacturing, the latter seeing a notable moderation of its downturn. Despite the easing seen in October, manufacturing remains in its worst spell since 2012 while construction is in its deepest downturn since 2009, with both appearing to be in recession. Service sector activity meanwhile stagnated, improving on the decline seen in September but still suggesting that the sector is stuck in its worst patch since 2012.

Weaker underlying trend
Weaker underlying trend
There are two indications that the business trend could weaken further in coming months. First, the disappointing October performance took place in spite of increased activity ahead of the cancelled Brexit date of 31st October. Many companies reported stock building and a flurry of activity to fulfil orders and safeguard against potential supply chain and other disruptions.
There are two indications that the business trend could weaken further in coming months. First, the disappointing October performance took place in spite of increased activity ahead of the cancelled Brexit date of 31st October. Many companies reported stock building and a flurry of activity to fulfil orders and safeguard against potential supply chain and other disruptions.
Second, the weak performance seen in October occurred despite firms supporting current activity by depleting backlogs of previously placed orders at one of the sharpest rates seen over the past decade.
Second, the weak performance seen in October occurred despite firms supporting current activity by depleting backlogs of previously placed orders at one of the sharpest rates seen over the past decade.
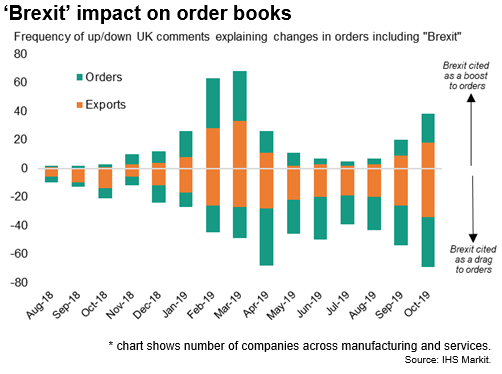
A key problem was a further drop in new work placed at companies. New orders fell for the eighth time so far this year, registering one of the steepest declines seen over the past ten years. Although signalling a slightly less steep decline than in September, October saw inflows of new work boosted by pre-Brexit ordering ahead of the 31st October departure date, both by domestic and export customers (exports of goods and services showed the smallest drop so far this year). However, the positive impact of pre-Brexit-related activity does not appear to have been as substantial as that seen earlier in the year, ahead of the prior March 31st Brexit deadline.
A key problem was a further drop in new work placed at companies. New orders fell for the eighth time so far this year, registering one of the steepest declines seen over the past ten years. Although signalling a slightly less steep decline than in September, October saw inflows of new work boosted by pre-Brexit ordering ahead of the 31st October departure date, both by domestic and export customers (exports of goods and services showed the smallest drop so far this year). However, the positive impact of pre-Brexit-related activity does not appear to have been as substantial as that seen earlier in the year, ahead of the prior March 31st Brexit deadline.

Brighter outlook
Brighter outlook
More encouragingly, survey responses collected later in the month - after the risk of a no-deal exit from the EU on October 31st had receded - generally came in stronger than earlier in the month, suggesting some of the paralysis from immediate Brexit-related worries had lifted. Likewise, business confidence about the next 12 months also improved, rising in October to the highest since July.
More encouragingly, survey responses collected later in the month - after the risk of a no-deal exit from the EU on October 31st had receded - generally came in stronger than earlier in the month, suggesting some of the paralysis from immediate Brexit-related worries had lifted. Likewise, business confidence about the next 12 months also improved, rising in October to the highest since July.
Sentiment nevertheless remains historically gloomy, and among the lowest recorded since the global financial crisis, primarily reflecting Brexit and political uncertainty, as well as more general concerns over slowing economic growth both at home and abroad.
Sentiment nevertheless remains historically gloomy, and among the lowest recorded since the global financial crisis, primarily reflecting Brexit and political uncertainty, as well as more general concerns over slowing economic growth both at home and abroad.
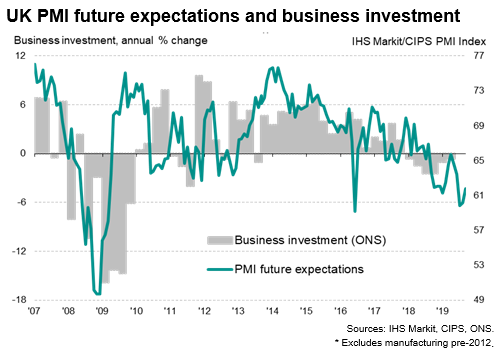
The survey's future expectations index is particularly interesting as it provides a useful advance indication of changing trends in official data on business investment. The weak sentiment seen in recent months therefore bodes ill for business investment, which has been falling in year-on-year terms since the start of 2018, and suggests that firms remained in cost-cutting mode on balance as far as capex is concerned at the start of the fourth quarter.
The survey's future expectations index is particularly interesting as it provides a useful advance indication of changing trends in official data on business investment. The weak sentiment seen in recent months therefore bodes ill for business investment, which has been falling in year-on-year terms since the start of 2018, and suggests that firms remained in cost-cutting mode on balance as far as capex is concerned at the start of the fourth quarter.

Job cuts among steepest since 2009
Job cuts among steepest since 2009
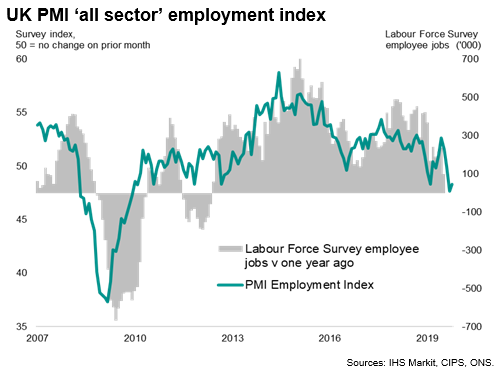
The lack of new order inflows and uncertainty about the outlook also continued to dampen firms' appetite to take on staff. Employment fell overall in October, with the rate of job losses easing only slightly on September to remain one of the fiercest since 2009. Net job losses were recorded in all three sectors for the second month running.
The lack of new order inflows and uncertainty about the outlook also continued to dampen firms' appetite to take on staff. Employment fell overall in October, with the rate of job losses easing only slightly on September to remain one of the fiercest since 2009. Net job losses were recorded in all three sectors for the second month running.

Costs rise at slowest rate since June 2016
Costs rise at slowest rate since June 2016
Price pressures meanwhile remained at their lowest for over three years. Average input costs showed the smallest monthly rise since June 2016, moderating in all three sectors, though to the greatest extent in manufactuiring, where lower commodity prices helped prevent costs from rising for the first time since March 2016.
Average prices charged for goods and services meanwhile showed the second-smallest monthly increase since July 2016, the rate of increase rising only modestly from September's recent low.

Looser policy bias
The ongoing decline signalled by the three surveys leaves the main PMI gauge of output deep in territory that would normally be associated with looser policy from the Bank of England, suggesting a greater likelihood of the next move in interest rates being a cut.
Such weak PMI readings as those seen in the third quarter have in fact never been seen before in over 20 years of PMI survey history in the absence of either recent or imminent stimulus, such as rate cuts or quantitative easing. Our expectation is that policymakers will once again sit on their hands at the next MPC meeting, choosing to delay any policy decisions amid the heightened political uncertainty emanating from the upcoming general election and the consequences for Brexit. However, the weak PMI readings suggest that the economy is deteriorating markedly as the Bank of England sits and waits for the Brexit fog to clear.


Disclaimer: The intellectual property rights to these data provided herein are owned by or licensed to Markit Economics Limited. Any unauthorised use, including but not limited to copying, distributing, transmitting or otherwise of any data appearing is not permitted without Markit’s prior consent. Markit shall not have any liability, duty or obligation for or relating to the content or information (“data”) contained herein, any errors, inaccuracies, omissions or delays in the data, or for any actions taken in reliance thereon.
In no event shall Markit be liable for any special, incidental, or consequential damages, arising out of the use of the data. Purchasing Managers' Index™ and PMI™ are either registered trademarks of Markit Economics Limited or licensed to Markit Economics Limited. Markit is a registered trade mark of Markit Group Limited.
