Market Overview
President Trump has been impeached. However, markets are paying very little attention. US politics has become hugely partisan during the time of an incredibly divisive President. The Democrat-controlled House has been perusing this impeachment process, but it is little more than political theatre. A simple majority in the House of Representatives was needed to “impeach” President Trump. However, the process needs to be “convicted” in the Senate by two thirds majority. The Republicans enjoy a 53-47 majority and thus means a highly unlikely 19 Republicans would need to vote against their President to convict the impeachment. The chances are extremely slim. So the political risk is being all but brushed off (although this could impact on Trump’s electoral chances of a second term).
Risk appetite remains relatively high and this is reflected in the underperformance of safe havens. VIX Volatility remains around multi-month lows, whilst Treasury yields moved higher (with a yield curve steepener). Equities and forex majors have become are a little cautious, but, this is more a function of a lack of conviction surrounding the true implications and components of the “phase one” US/China trade agreement. The Dollar/Yuan rate hovering almost bang on 7.00 in recent days reflects this. The Bank of Japan did very little to change the narrative in its latest monetary policy decision.
Wall Street closed a very subdued session around the flat line yesterday, with the S&P 500 -1 tick at 3191. With US futures again all but flat today, Asian markets have struggled for direction (Nikkei -0.3% and Shanghai Composite flat). European markets continue this theme with FTSE futures and DAX futures all but flat.
In forex, there is a slight improvement in risk which has allowed EUR and perhaps more interestingly, GBP to find support. The big mover of the early part of the session is outperformance from AUD which is higher on better than expected employment data.
In commodities, we see the continued consolidation on gold whilst oil is also consolidating its recent run higher.
There is a UK focus on the economic calendar early today. At 09:30 GMT UK Retail Sales (ex-fuel) are expected to grow by +0.3% for the month of November (after falling by -0.3% in October) which would mean that the year on year growth drops back to +1.9% (from +2.7% in October). The Bank of England monetary policy is at 12:00 GMT with the MPC not expected to move the interest rate at +0.75%, but of more interest will be on how many members vote for a cut. In November there were 7 votes to hold and 2 votes to cut. This is expected to be the same again in December. On to the US data,
US Current Account is at 1330GMT and is expected to see the deficit improve slightly to -$122.1bn in Q3 (from $-128.2bn in Q2).
Weekly Jobless Claims are at 1330GMT and are expected to moderate slightly to 225,000 (from the spike to 252,000 last week). The Philly Fed Business index at 13:30 GMT is expected to slip slightly to +8.0 (from +10.4 in November). Existing Home Sales at 1500GMT are expected to drop by -0.2% to 5.44m in November (from 5.46m in October).
Chart of the Day – USD/CAD
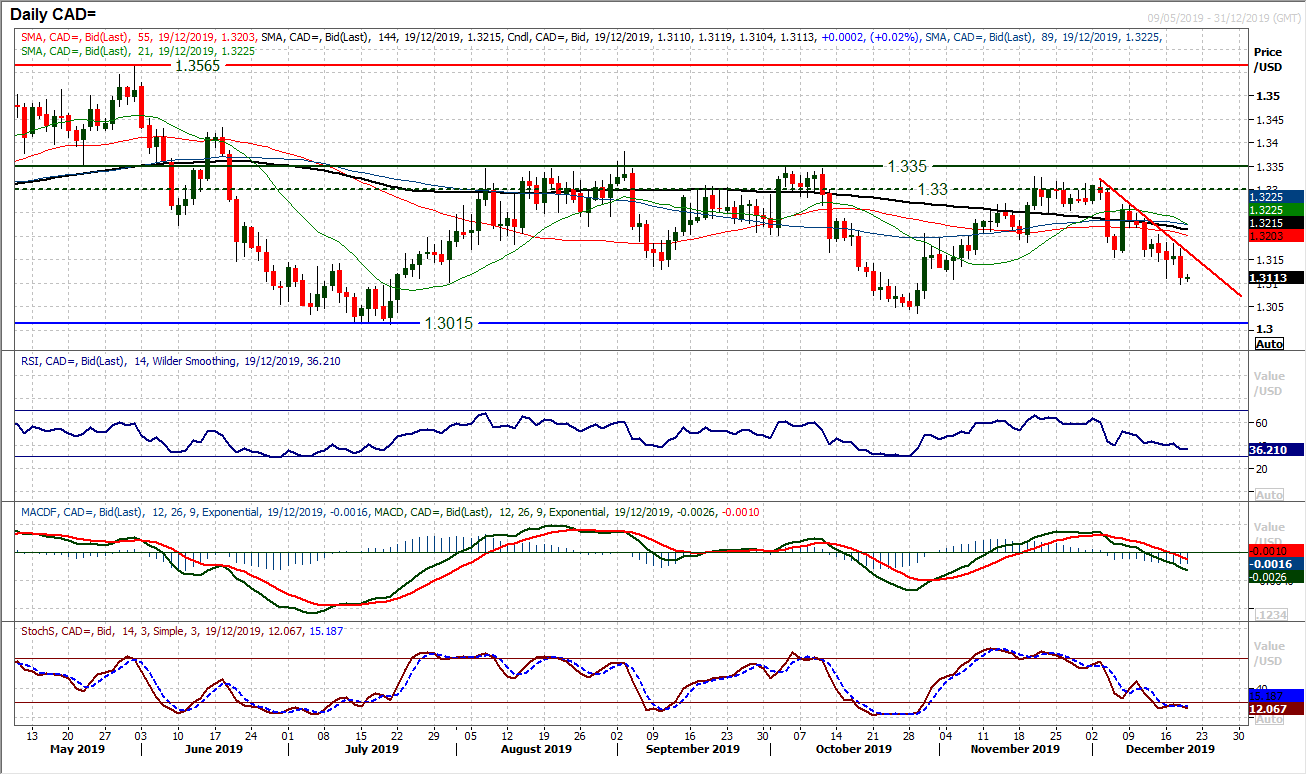
The Canadian dollar has consistently repelled US dollar strength throughout 2019 and once more is finding positive traction towards the end of the year. For the past six months, the price has traded in a broad range between 1.3015/1.3350. Resistance around 1.3300/1.3350 once more found Canadian dollar buyers willing to come back in to pull USD/CAD lower. This move is now trending decisively and eyeing a test of the range lows again between 1.3015/1.3035. A two week downtrend of lower highs breached support at 1.3150 this week and with continued deterioration in the momentum indicators, there is downside potential in this latest bear run. The RSI confirms the recent breach of support and is negatively configured below 40, whilst the MACD lines are now falling below neutral and Stochastics are bearishly configured. Into today’s session, the mini downtrend is resistance at 1.3165 with the old support around 1.3150 now resistance and we look to sell into near term rallies. The near term resistance at 1.3185/1.3205 is key to the continued correction lower. A move below support at 1.3105 opens 1.3015/1.3035.
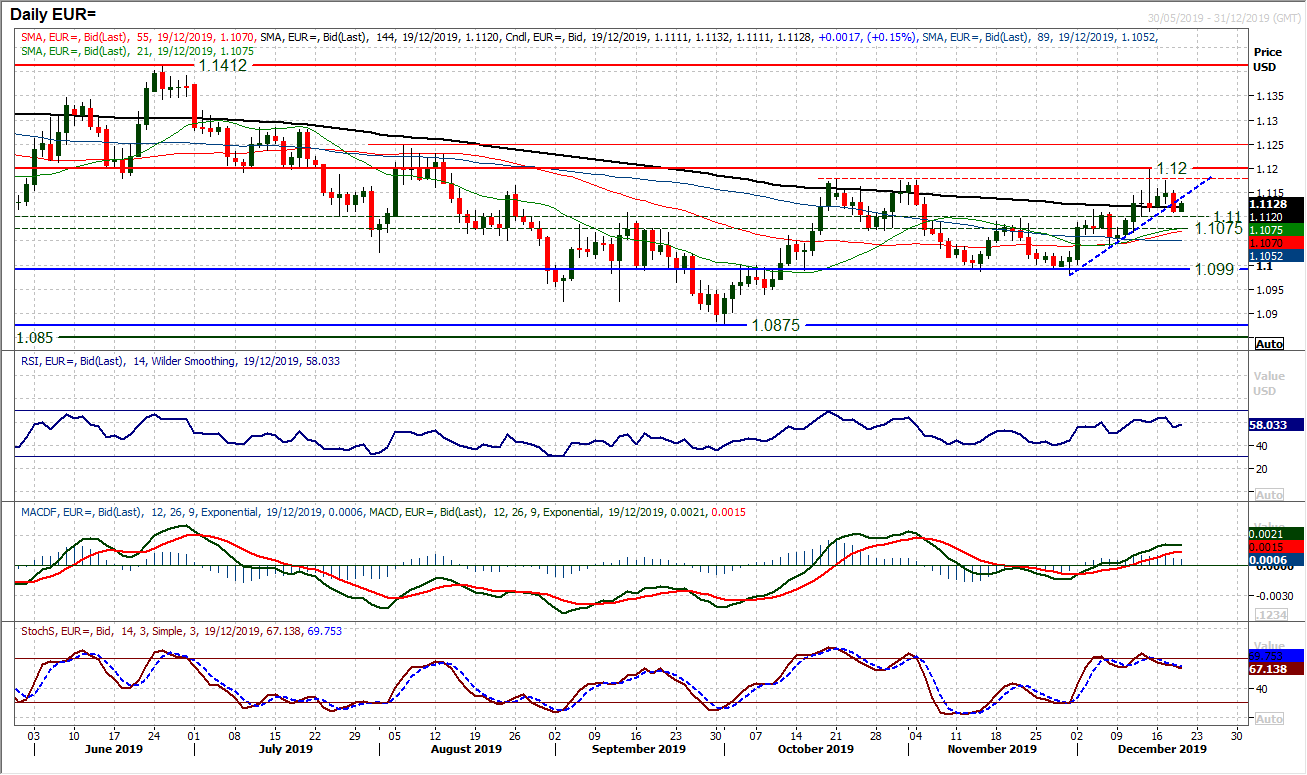
The euro recovery has been nipped in the bud again as the resistance of what is now a two month trading range has kicked in. An uptrend of the past two weeks has been breached by a decisive negative candle yesterday. The question is whether this is now a consolidation or the beginning of another retracement back towards the range lows around $1.0980/$1.1000. The key will be the mid-range support at $1.1075/$1.1100. We still see positive momentum configuration (RSI high-50s, Stochastics relatively stable and MACD lines above neutral. The initial reaction early today has been positive and the hourly chart shows support at $1.1110 holding. Hourly RSI reflects a consolidation rather than correction, but losing $1.1110 support would be a warning. Resistance of $1.1175 is a lower high now that needs to be breached to re-assert bull control for pressure on $1.1200 resistance.
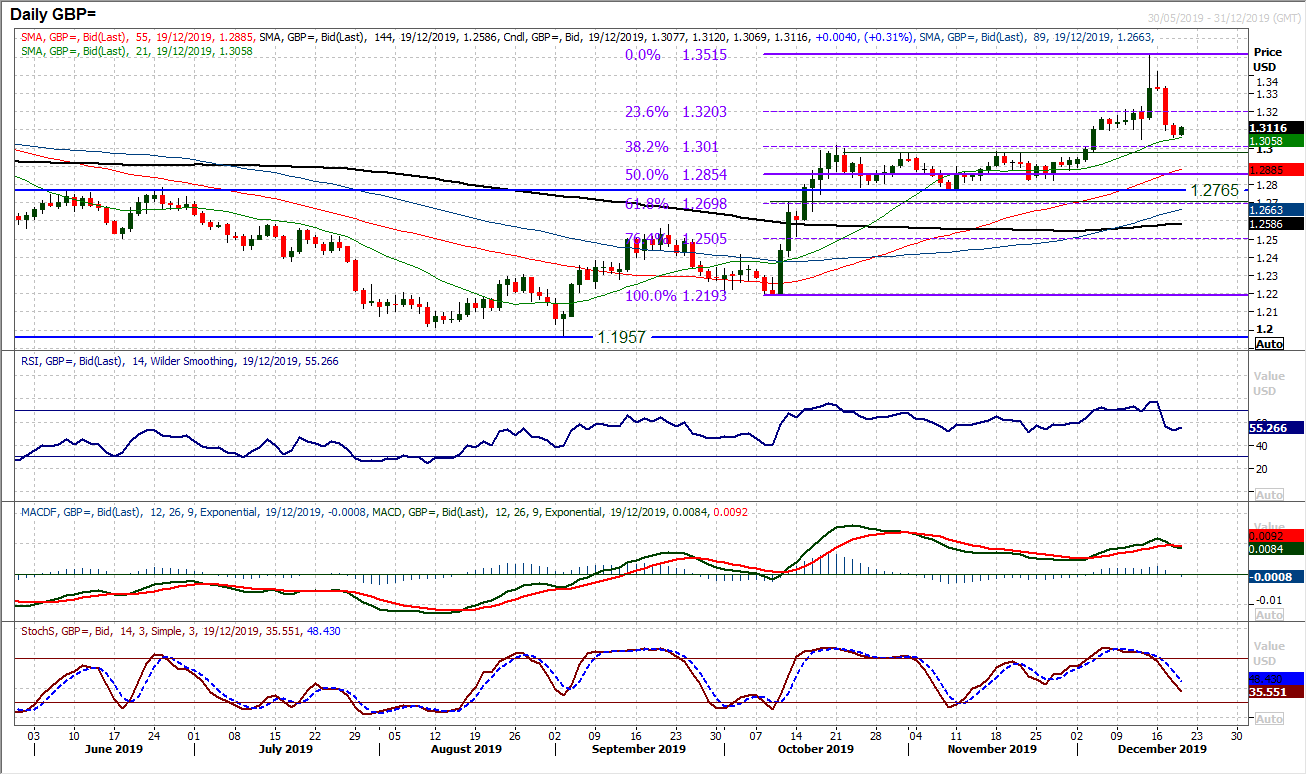
Sterling has come under renewed negative pressure in recent sessions as the politics of the UK’s Brexit once more come to the fore. A pullback from the $1.3515 post-election high has already gone through the 23.6% Fibonacci retracement (of the $1.2193/$1.3515 big bull run) around $1.3200. There is an interesting confluence at the old resistance of $1.3010 which is also the 38.2% Fib level. This old resistance is now a basis of key support (key band of old highs $1.2975/$1.3010). The RSI has now unwound into the low 50s around where the November lows were posted and if the bulls can begin to gather themselves then this could prove to be an interesting technical buying opportunity. There is price support initially around $1.3050 to also work from.
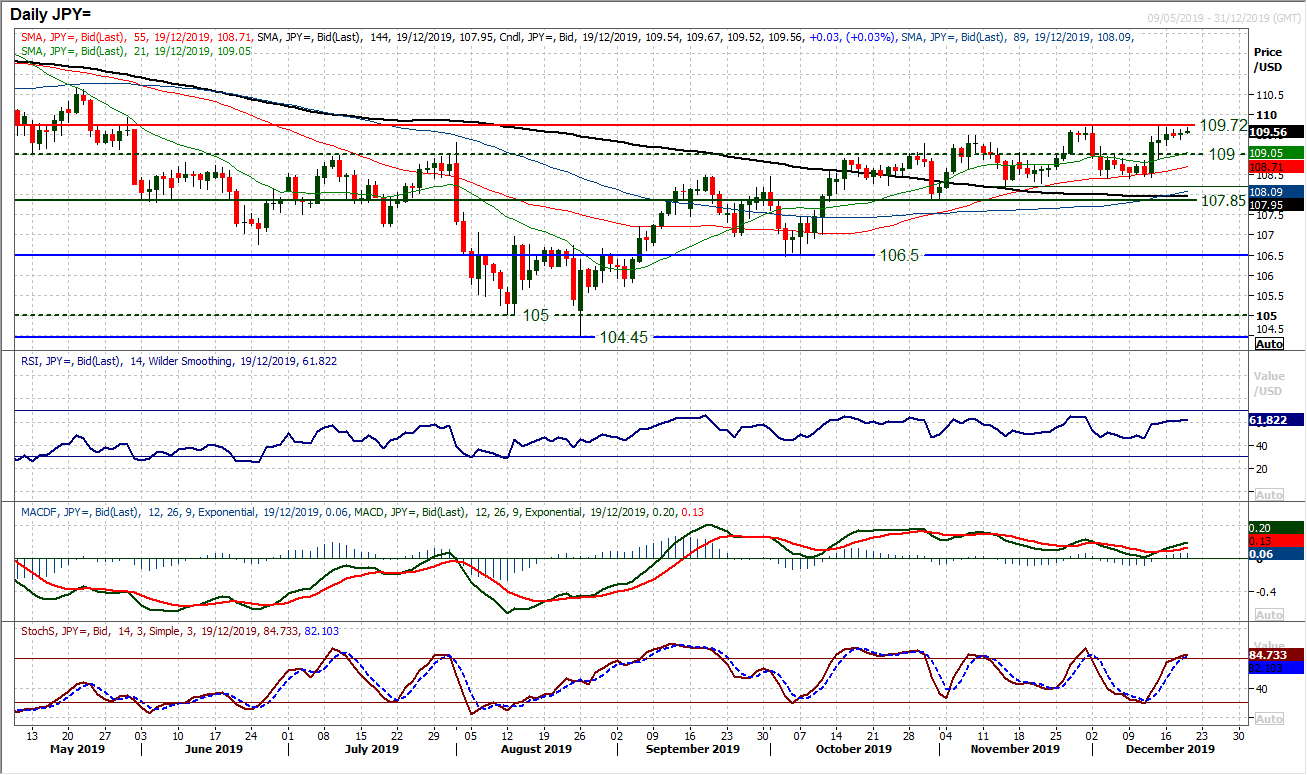
We are broadly positive on Dollar/Yen as the succession of higher lows continues. However, it is a real slog for the bulls to find any traction in the move higher. We have long noted that breaking consistently above 109.00 resistance would suggest the bulls gaining control and once more we have seen the market closing consistently above 109.00 in the past week. However, resistance at 109.70 has restricted the bulls again and in the past few sessions, the positive candles have started to turn more mixed, hinting at a lack of conviction. There is still upside potential in the momentum indicators. The RSI is around 60 and tends to falter around 65 on the bull runs, whilst the MACD lines have only just crossed higher and Stochastics still also have room to go. However, as has so often been seen in previous weeks, the breakouts quickly lose traction and are met with a retracement. Buying into weakness is therefore the strategy. The latest higher low is at 108.40 whilst the rising 55 day moving average is at 108.70 and is a good basis of support now. A retreat that finds support around 109.00 would be a good opportunity. A breakout above 109.70 would find resistance sitting at 109.90, whilst 110.65 is key.
Gold
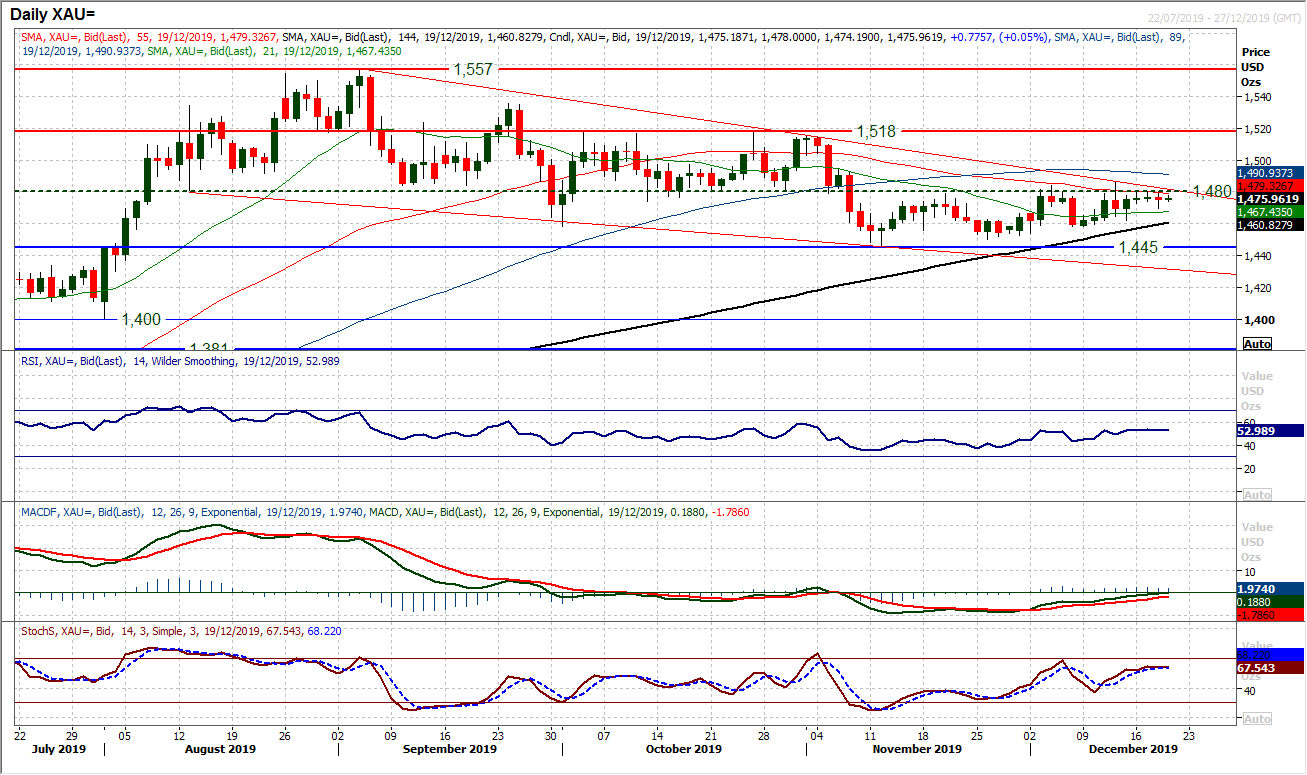
Gold continues to struggle with the overhead supply around $1480 restricting upside. This remains a crucial crossroads with the added resistance of the upper bound of the downtrend channel (today coming at $1482). In recent sessions we have seen momentum indicators drifting higher into an area where the previous rallies of the past four months have failed, so this seems to be a key inflection point. This week has seen a run of candle almost entirely lacking conviction and direction has been lost. This is another very important crossroads which will define the next near to medium term direction. Given the consideration the market is lending to this resistance around $1480, any closing breakout would be a key shift in sentiment. A close above $1487 would be a six week high and suggest bull traction. The hourly chart shows initial support at $1470 but a move back under a pivot at $1465 would signal another bull failure.
WTI Oil
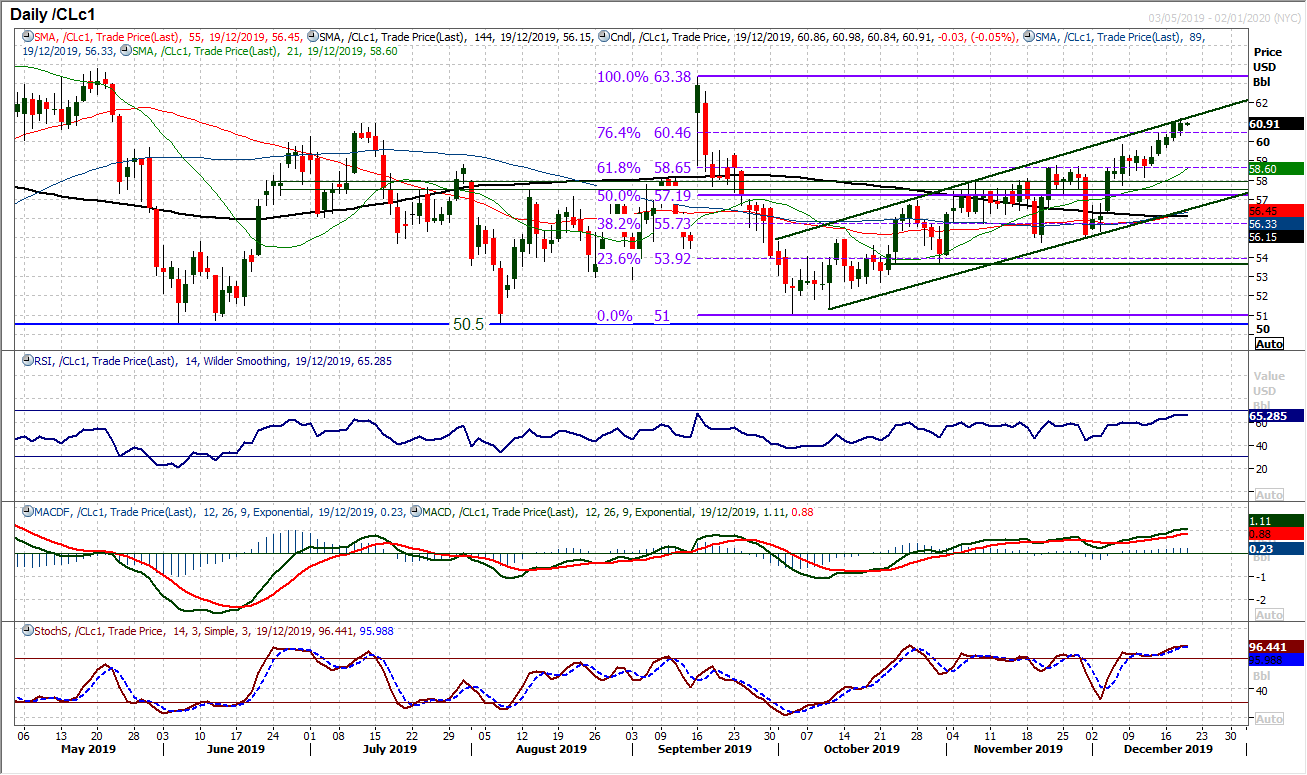
The market has consistently looked to buy into intraday weakness since the OPEC meeting a couple of weeks ago. A run of positive candles have pulled the market to the top of the uptrend channel (which today comes in at $61.25). Of significance also, the move has also now started to pull higher above the 76.4% Fibonacci retracement (of $63.40/$51.00) at $60.45. Closing decisively clear above would open a full retracement back to the high again at $63.40. The move in the past week has also looked to strengthen the importance of the breakout support band $57.85/$58.65. For now, we see strengthening momentum with the RSI into the mid-60s and MACD lines at seven month highs. Ultimately we are still mindful that retracements of bull breakouts are frequent within the trend channel and therefore weakness would be a chance to buy.
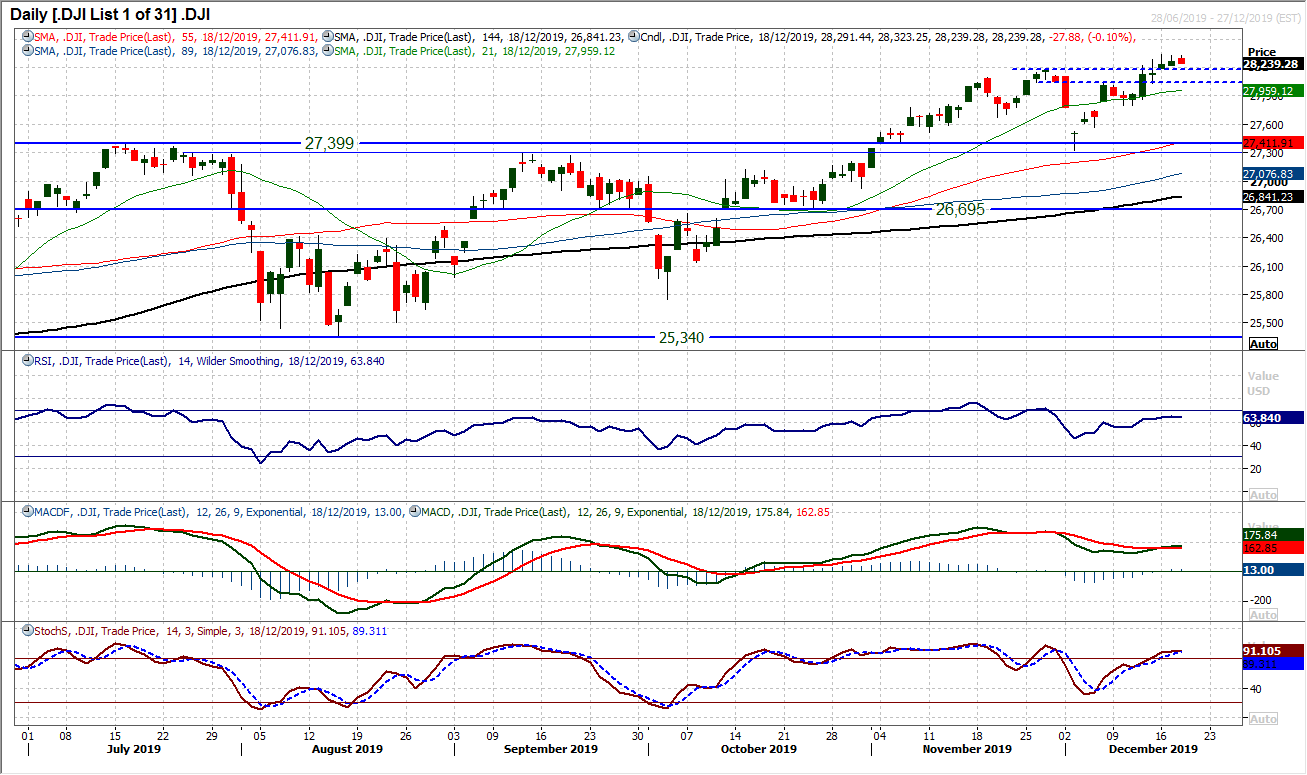
Equity markets have been somewhat tentative in recent sessions. Since the turn of the week and a questioning of the phase one agreement between the US and China, the Dow has been slightly edgy in its breakout to new highs. Small candlestick bodies and three daily ranges well shy of the Average True Range of 219 ticks. The momentum indicators are positively configured but in the wake of yesterday’s marginal close lower (also at the low off the day) there is a tempering of the impetus. However, RSI remains above 60 and Stochastics above 80. We could continue to see near term corrections as a chance to buy (US futures are all but flat this morning). There is a band of initial breakout support at 28,035/28,175 and the bulls would be in control whilst the support at 27,800 remains intact. The Dow would turn corrective on a move below the December low at 27,325.
"""DISCLAIMER: This report does not constitute personal investment advice, nor does it take into account the individual financial circumstances or objectives of the clients who receive it. All information and research produced by Hantec Markets is intended to be general in nature; it does not constitute a recommendation or offer for the purchase or sale of any financial instrument, nor should it be construed as such.
All of the views or suggestions within this report are those solely and exclusively of the author, and accurately reflect his personal views about any and all of the subject instruments and are presented to the best of the author’s knowledge. Any person relying on this report to undertake trading does so entirely at his/her own risk and Hantec Markets does not accept any liability. """
