The weaker than expected inflation pressure in US could weigh down on the interest rate outlook driving the greenback down across the broad.
After June US CPI release has shown yearly rising by only 1.6%, while the consensus was referring to rising by 1.7%, after surging by 1.9% in May.
June US Retail sales figure came also disappointing showing monthly decreasing by 0.2%, while the median forecast was referring to increasing by 0.1%, after falling by 0.3% in May had been revised to be by only 0.1%.
The preliminary release of July Michigan Consumer Sentiment Index came also down to 93.1, while the market was waiting for easing down to 95 only, after 95.1 in June to spur worries about the consuming spending strength in US.
The lower interest rate outlook in US has already started to dominate the market sentiment earlier last week.
After The Fed's Chair Janet Yellen's signal that the Federal Reserve won’t be in rush to tighten monetary policy in her congressional testimony, while the prices are facing downside pressure because of structural causes.
She said also that the monetary policy has become close to normal lowering the roof of the market expectations.
Yellen refrained also from referring to a certain time of triggering unwinding of
The Fed's $4.5 trillion balance sheet.
After the committee mentioned in its statement following last Jun. 15 meeting that it is currently expecting to begin implementing a balance sheet normalization program this year, as the economy evolves broadly as anticipated.
The committee had started to prepare the markets for such waited action in the previous meetings of it, before it managed finally to set on Jun 15 meeting its unwinding plan details for normalizing its balance sheet but without determining of the starting date of this action.
The Fed announced that the initial cap will be set at $10 billion a month "$6 billion from Treasuries and $4 billion from mortgage-backed securities", before rising every three months by this same scale until the caps reach $30 billion of US treasuries and $20 billion of MBS.
The US treasuries yields have been negatively impacted by this lower interest rate outlook, while Dow Jones and S&P 500 could keep their pace of recording new all time highs, amid higher earnings reports of the second quarter and energy prices rebounding tries.
The energy prices rebounding could boost the Canadian dollar to keep its upside momentum, as the Canadian economy depends on exporting commodities and crude oil especially to US.
USDCAD is now below 1.2654 supporting level which has been forming a floor to the pair, after rebounding from it on Jun. 8, 2016.
While BOC decision to raise the target of its overnight interest rate by 0.25% to 0.75% is still underpinning the loonie which has now higher interest rate outlook on BOC readiness to follow the Fed in its tightening path.
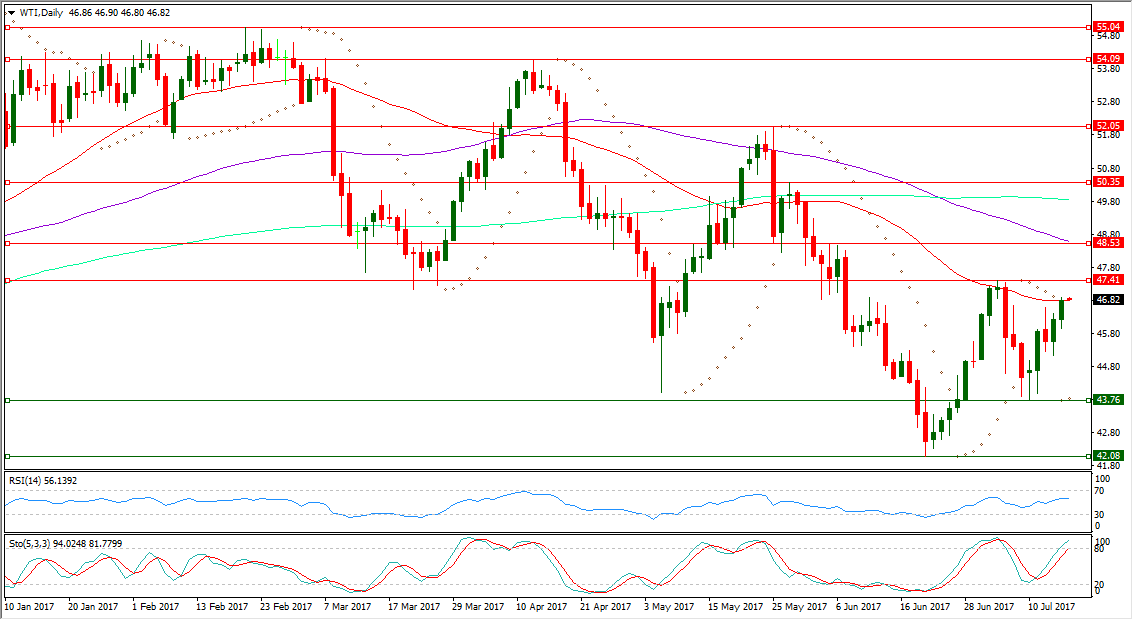
WTI is trading now in a close place to $47 per barrel, after it could form a higher low at $43.76 above last Jun. 21 shaped bottom at $42.08.
As US EIA crude oil inventory data could boost it by showing last week falling in the week ending on Jul. 7 by 7.564m barrels to 495.350m suggesting that OPEC cut could start to take its toll on the inventories.
After forming higher low $43.76, WTI could rise for meeting now its daily SMA50 but it's still depressed over longer run by continued being below its daily SMA100, its daily SMA200.
WTI rebounding could help it to be trading now in its second day above its daily Parabolic SAR (step 0.02, maximum 0.2) which is reading $43.82 today.
WTI can gather upside momentum by coming over its resistance at $47.41 which stopped its bouncing up previously from $42.08.
WTI daily RSI-14 is referring now to existence in a higher place inside its neutral territory reading 56.139.
While WTI daily Stochastic Oscillator (5, 3, 3) which is more sensitive to the volatility is having its main line now inside its overbought region above 80 at 94.024 leading to the upside its signal line which is lower in this same area at 81.779.

Important levels: Daily SMA50 @ 46.80, Daily SMA100 @ 48.58 and Daily SMA200 @ 49.84
S&R:
S1: 43.76
S2: 42.08
S3: 39.65
R1: 47.41
R2: 48.53
R3: 50.35
