As expected the FOMC kept the interest rate unchanged between 0.75% and 1% with no change of its $4.5 trillion balance sheet by unanimous decision.
After the lower than expected US GDP annualized expansion in the first quarter of this year which has been by 0.7% attributed to lower consumption.

This reason which can be transitory as the Fed's mentioned has been highlighted in the FOMC members statement with potential hopes for watching upward revision of this reading and also better growth rate later this year.
There was no scheduled press conference of the Fed's chief Yellen following that meeting but the market is to wait for speech from her by the week end following the release of US labor report of April which is to take the markets attention next.
Regarding the inflation forces building up, the Fed's has mentioned today that it is running below but close to its 2% yearly inflation target.
While the unemployment rate in March was at 4.5% which has been its lowest since May 2007, showing meanwhile that the labor market is at the maximum expected capacity by the Fed.
The Fed assured by this way on its gradual pace of tightening and again it did not mention the impact of reflation and also it has not referred to over leveraged rates in the equities market at the current prices levels.
The statement could spark trust in loading risks in the equities market backed by lower interest rate outlook, as it is not expected now to watch more than 2 more rates hikes by 0.25% this year.
The demand for a safe haven setback driving gold to be traded now below $1240 per ounce, while UST 10 years note yield came down by 0.02% to 2.29%.
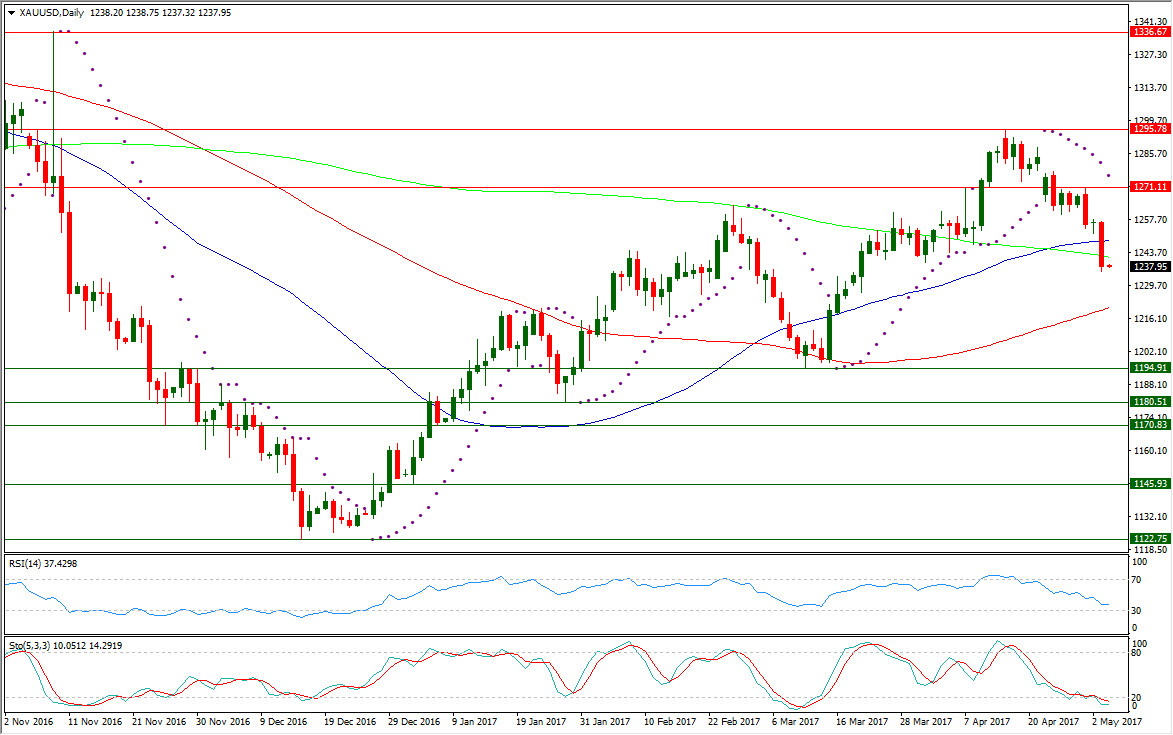
The gold has been exposed to selloff drove it down below $1239.62 per ounce supporting level which could prop it up previously on Mar. 31 overlapping the price range of the upside wave from $1180.51 to $1263.85 undermining the ascending channel.
XAUUSD is now well below its daily SMA200, after falling below its daily SMA50 but it is still above its daily SMA100 in its ninth day below its daily Parabolic SAR (step 0.02, maximum 0.2) which is reading today $1276.26.
After inability to have a place above its psychological level at $1300, to be satisfied by reaching $1295.46, whereas it has formed a lower high on last April 17 to ease down again to the current levels.
After yesterday increasing of the downside momentum , XAUUSD daily RSI-14 is referring now to existence at a lower place inside its neutral area reading 37.429, after it has been earlier into the overbought area above 70.
XAUUSD daily Stochastic Oscillator (5, 3, 3) which is more sensitive to the volatility is having now also its main line in its oversold region below 20 at 10.051 leading to the downside its signal line which is also in the same territory at 14.291.
Important levels: Daily SMA50 @ $1248.71, Daily SMA100 @ $1220.48 and Daily SMA200 @ $1241.93
S&R:
S1: $1194.91
S2: $1180.51
S3: $1170.83
R1: $1271.11
R2: $1295.78
R3: $1336.67
