The talking about the Fed's Balance sheet can gather momentum ahead containing the market sentiment.
As the Fed's last meeting minutes of last March have shown serious talking this time about unwinding the Fed's portfolio of treasuries and mortgage backed securities, not just reference to this holding as what has happened in the previous meetings minutes.
The Fed's balance sheet is containing now $4.5 trillion, After 3 Fed's QE rounds for propping up the US economy because of the credit crisis.

As The Fed has kept until now the principal of repurchasing these financial securities it holds on their maturities.
I should mention here also that the Fed has made what's named an Operation Twist program in late 2011 and 2012 to stimulate the economy by buying longer term Treasuries selling some of its holding of short term treasuries for pressing on the long term treasuries yields in the secondary market.
The operation twist has been taken place in 2 rounds. The first has been from September 2011 till June of 2012 and its value was $400 billion, while The second has been from July 2012 to December 2012 and its value was $267 billion.
The Fed’s now holding about $425 billion of Treasuries maturity in 2018 and also about $350 billion for 2019.
The Fed can manage to reverse this twist by lower its Bonds maturities or stopping its reinvestment in the US debt.
But The FOMC's members talking currently about that crucial subject is still looking to the market participants in a preliminary phase for testing the market reactions.
While this tightening action can be later looking a must during the Fed's current tightening cycle, after the credit crisis and it should be done by a gradual way can be prematurely expected.
We have seen last week how Federal Reserve Bank of New York President William Dudley has said that "U.S. government policy may further boost the economy and eventually add fuel to an inflation rate is already approaching the central bank’s official target"
Which means that the Fed's is taking into its account the inflation pressure which can result from the waited reflation in US new administration.
The Fed Bank of Boston President Rosengren has also signaled a week ago that 4 Fed fund hikes by 0.25% in 2017 may be needed to cool the overheating economy.
The Fed Bank of San Francisco John Williams came out to be in line with Rosengren saying that it would not be ruled out to see more than three hikes this year.
Even The Fed's chief Yellen has said last week in her text speech in Washington that the economy overall is recovering, the inflation is going up to the 2% Fed's yearly target and the job market has improved substantially since the recession
She has managed to take the attention away from the monetary policy role to stimulate the economy which is setting back by saying that "for driving down the elevated joblessness in poor and minority communities, we just need now better education and training"
While the markets are watching currently very impressive positive signs can encourage the Fed's to go on its tightening cycle, such as Mar US ADP Employment change which has shown yesterday soaring by 263k, while the consensus was referring to increasing by 187k, after adding 245k in February.
And also Mar Consumer Confidence Index which has shown last week rising to 125.6 which is its highest level since December 2000.
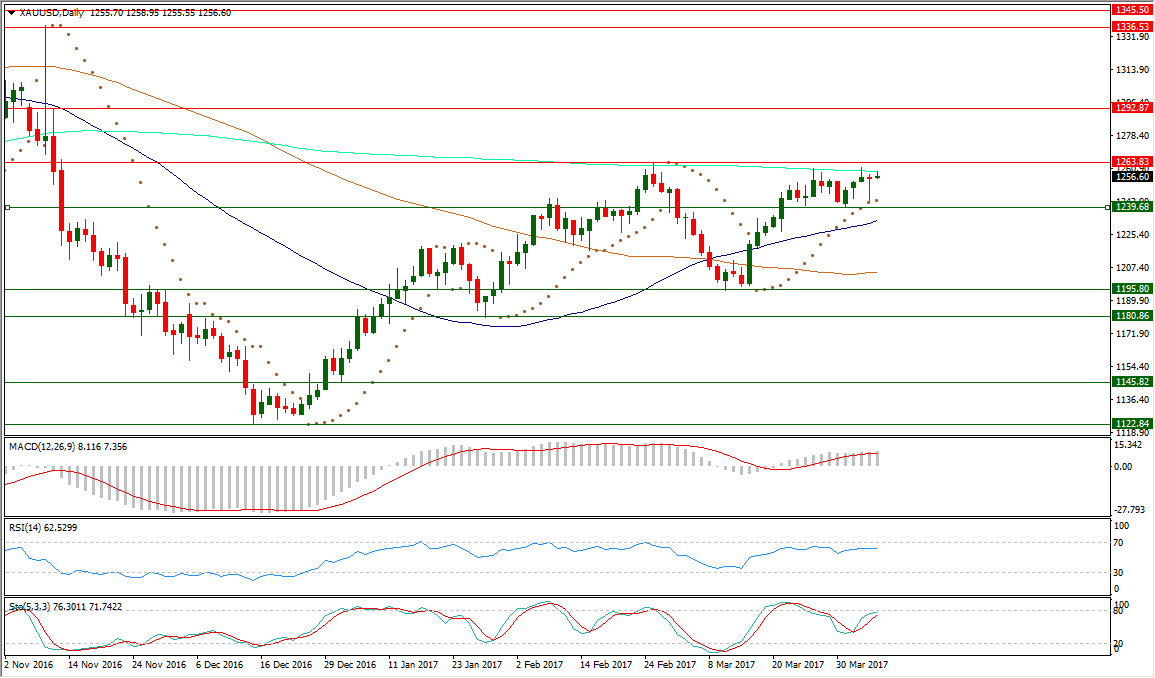
The gold is still keeping its trading now near $1255 in its sixteenth day of being above its daily Parabolic SAR (step 0.02, maximum 0.2) which is reading 1243.70.
After the gold had formed a higher low at $1239.68 above its low at $1195.80 which has come after forming a higher bottom on last Jan. 27 at $1180.53 to come by its turn above its previously formed bottom on last Dec. 15 at $1122.85.
XAUUSD daily RSI-14 is referring now to existence inside the neutral region reading now 62.529.
XAUUSD daily Stochastic Oscillator (5, 3, 3) which is more sensitive to the volatility is having now its main line in the neutral region at 76.301 leading to the upside its signal line which is at 71.742.
The Gold is now above its daily SMA50, after surpassing its daily SMA100 but it is still in intersection with its daily SMA200, below its peak at $1263.83 which has been formed with meeting with this average on last Feb. 27.
Important levels: Daily SMA50 @ $1232.73, Daily SMA100 @ $1204.79 and Daily SMA200 @ $1258.84
S&R:
S3: $1239.68
S2: $1195.80
S3: $1180.86
R1: $1263.83
R2: $1292.87
R3: $1336.53
