Market Overview
The new trading week begins with a stabilisation of sentiment. With Treasury yields showing signs of calm (dare we say, a low), there is a more settle outlook across major markets on Monday morning. The US yield curve steepened into the close on Friday (by “steepened”, we mean the 2s/10s spread has picked up to a heady +7bps). Equities volatility has also dropped sharply as support has begun to form. How sustainable this all is remains to be seen, but volatility remains elevated (VIX above 18) and this could still just be the calm before the next storm. The main reaction has been for a shift out of safety and into higher risk again. That means, gold slipping of its lofty positon, whilst the yen and Swiss franc unwind some of their outperformance. On the flip-side, we see equities picking up nicely this morning, as oil has also opened higher. In the currency space, sterling and the Aussie are also continuing to gain ground. Recent history would caution us with getting too carried away with such a swing in sentiment though. The next blow up in the trade dispute and/or Trump protectionist move could be just around the corner. Newsflow remains key.
On Wall Street, a strong rally into the close on Friday (S&P 500 +1.4% at 2888) with US futures continuing this move today (+0.6%) are helping Asian markets higher today. The Nikkei closed +0.7% higher with Shanghai Composite +1.7%. In Europe, there is a positive start to trading, with FTSE futures +0.6% and DAX futures +0.7%.
In forex, the recent bounce on GBP shows signs of continuing early today, with a mild risk positive skew to the majors.
In commodities, this more positive sentiment is a drag on gold which is -$5 and oil opening higher by over +1%.
The Eurozone is in focus on the economic calendar today. The Eurozone Current Account is at 1000BST and is expected to show the surplus increasing to +€32.2bn in June (from +€29.72bn in May). The final reading of Eurozone inflation for July is at 10:00 BST and is expected to show no changes to the headline HICP at +1.1% (+1.1% flash, +1.3% final June), with core HICP expected to remain at +0.9% (+0.9% flash, +1.1% final June).
Chart of the Day – Silver
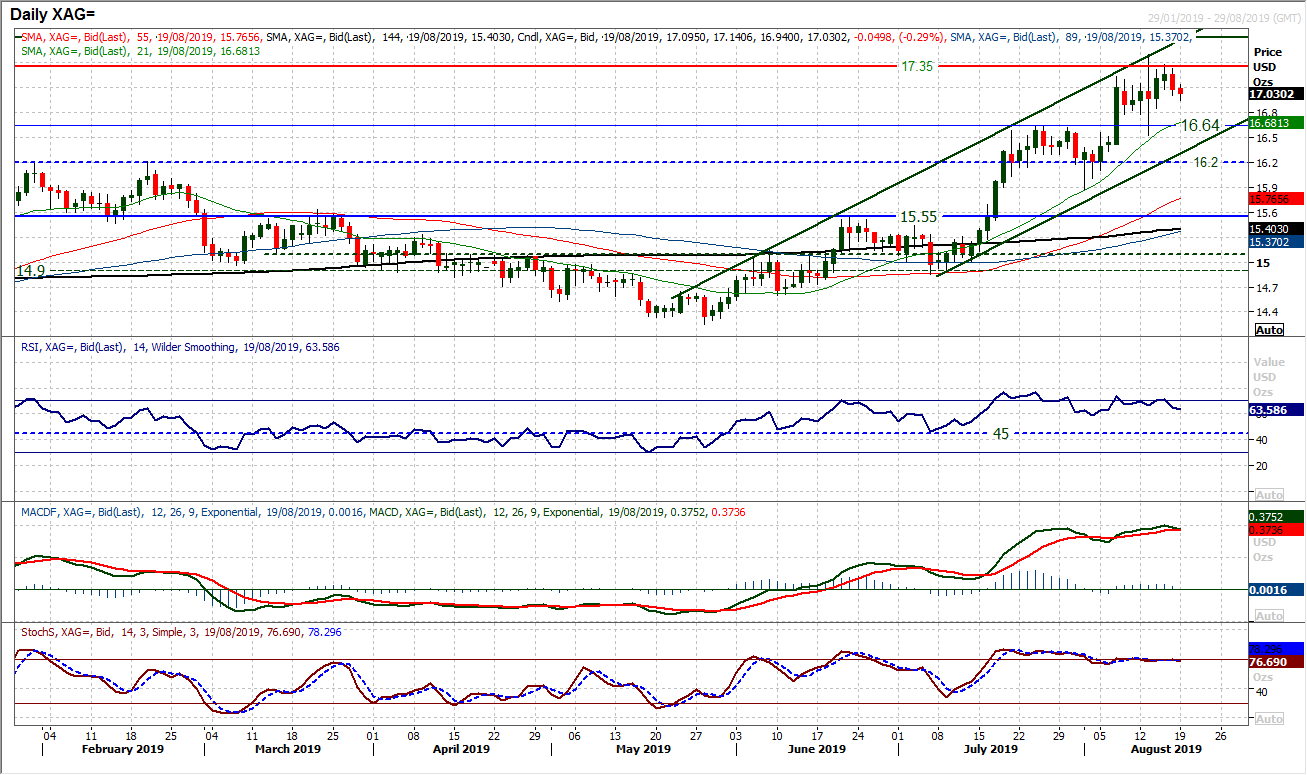
The market has been pulling decisively higher in an uptrend channel since the middle of May as near term corrections are being used as a chance to buy. However, silver has hit the long term resistance at $17.35 (from April and June 2018 highs) and started to consolidate. This is the next big test for this silver rally. The market pulled back slightly on Friday, with a mild negative candle and some near term profit-taking is threatening. For now we would still see this as a near term corrective move within the uptrend channel and should be a source of the next opportunity to buy. Similar to the near term pivot at $1510 on Gold, there is a near term pivot at $17.10 which will be seen as a gauge for a consolidation. Slipping under $17.10 just leaves a near term drift open within what is now a mini consolidation. A range between the support band $16.53/$16.64 and resistance at $17.50 is developing, however, we would see weakness within this band as a chance to buy. The rising 21 day moving average (currently c. $16.68) is a good basis of support now for a corrective slip. Positive medium term momentum is just threatening to roll over and the RSI has room to slip back towards 60 and still be strongly configured.
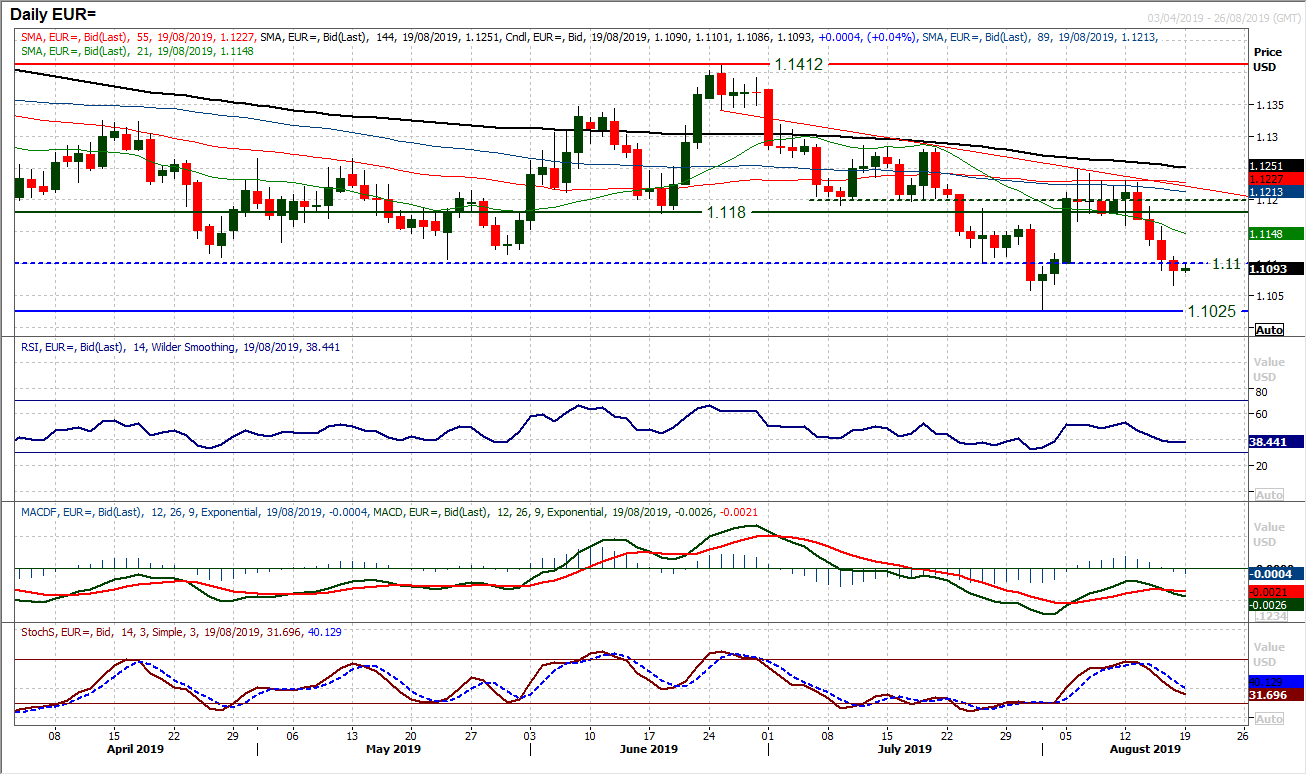
The euro has now seen a run of four consecutive negative candles as the move lower has taken hold. There is now a feeling that rallies are now a chance to sell as momentum indicators deteriorate within their medium term negative configurations once more. RSI is back under 40, MACD lines are bear crossing under neutral and Stochastics are in decline. Breaching the old support at $1.1100 on a closing basis has re-opened the prospect of $1.1025 support being tested again. The hourly chart shows lower highs and lower lows, along with hourly RSI stuck under 60 and MACD lines stuck under neutral. Fairy standard negative configuration outlook. For this to change, the bulls will need to be eyeing the resistance at $1.1100/$1.1120 to generate a recovery. The falling 55 hour moving average is also a good gauge of who is in control now. Above $1.1120 opens $1.1160. Initial support at $1.1065.
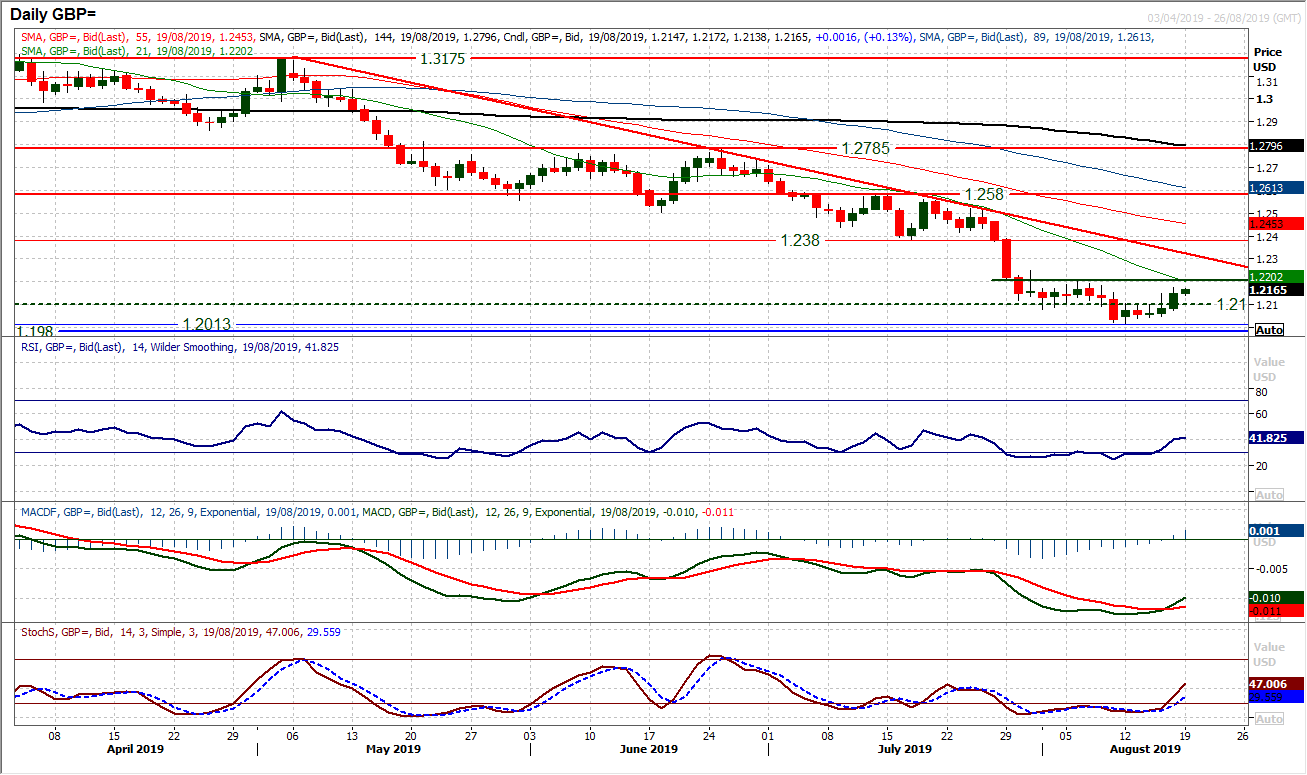
Sterling has picked up in the past few sessions, but is a rally sustainable? The near term prospects of the bulls will be looking towards $1.2210/$1.2250 resistance to be indicative. A cross higher on MACD and Stochastics is encouraging, but RSI has repeatedly seen rallies fail between 45/53 for months now. This near term move is worth backing for now, with the hourly chart showing a far better configuration on momentum. Hourly RSI finding lows above 40 and MACD above neutral. However, the daily chart is still showing the weight of indicators suggesting a sell into this strength. The 21 day moving average at $1.2200 is an initial gauge of resistance. There is though room for this bounce to pull into the three and a half month downtrend (at $1.2325 today). This leaves us all very cautious of this recovery which we see will prove to be a chance to sell for what is likely to be further pressure on $1.2000.
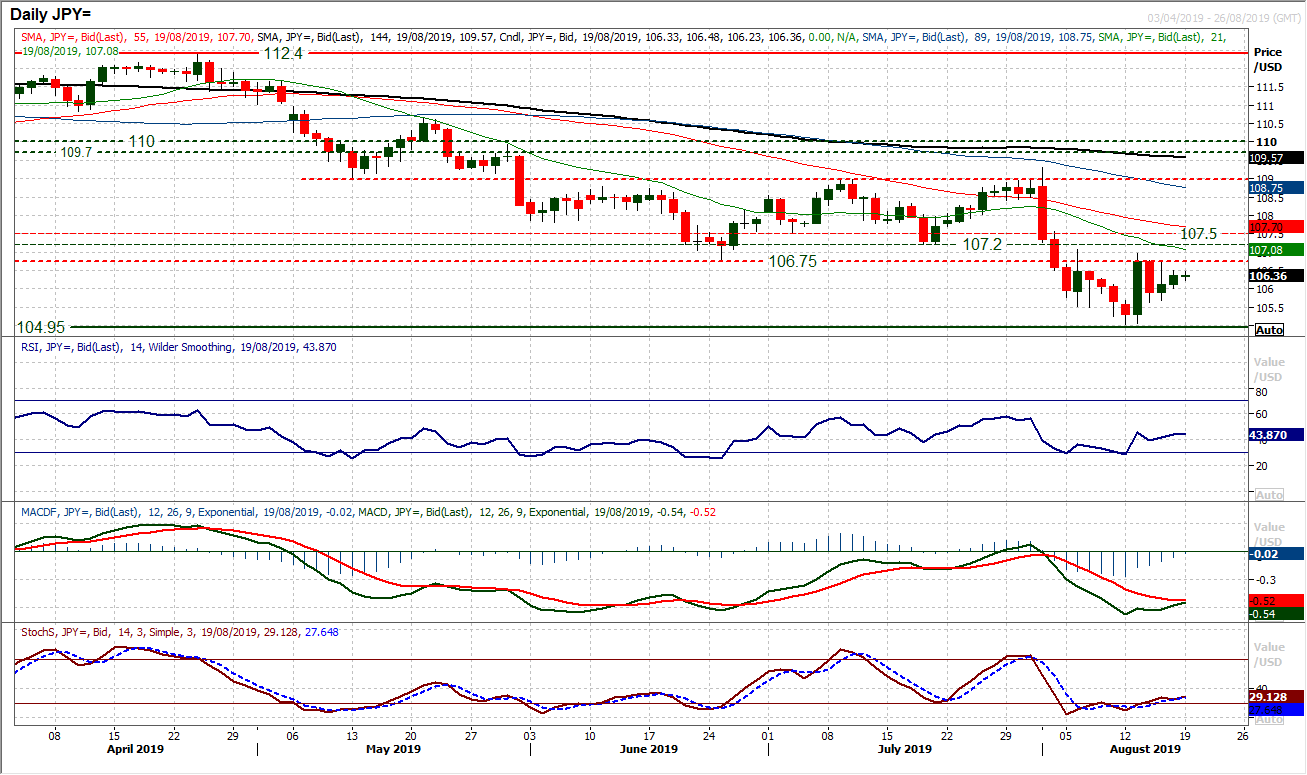
A second day of gains ended last week on a decent note for the dollar bulls. This has pulled Dollar/Yen higher again, but we continue to see the band of overhead supply between 106.75/107.50 as a key barrier to any recovery. The continued failures around 106.75 show that this is a key level to watch now for any prospective recovery on an improvement in risk appetite. Whilst the market picking up in the past couple of sessions is encouraging, it still remains a fairly muted move. With negative medium term configuration on momentum indicators, rallies remain a chance to sell. This would only really change if there were to be a recovery through 107.50. There is support at 105.65 which protects the August low at 105.03, with Friday’s low supportive at 106.00.
Gold
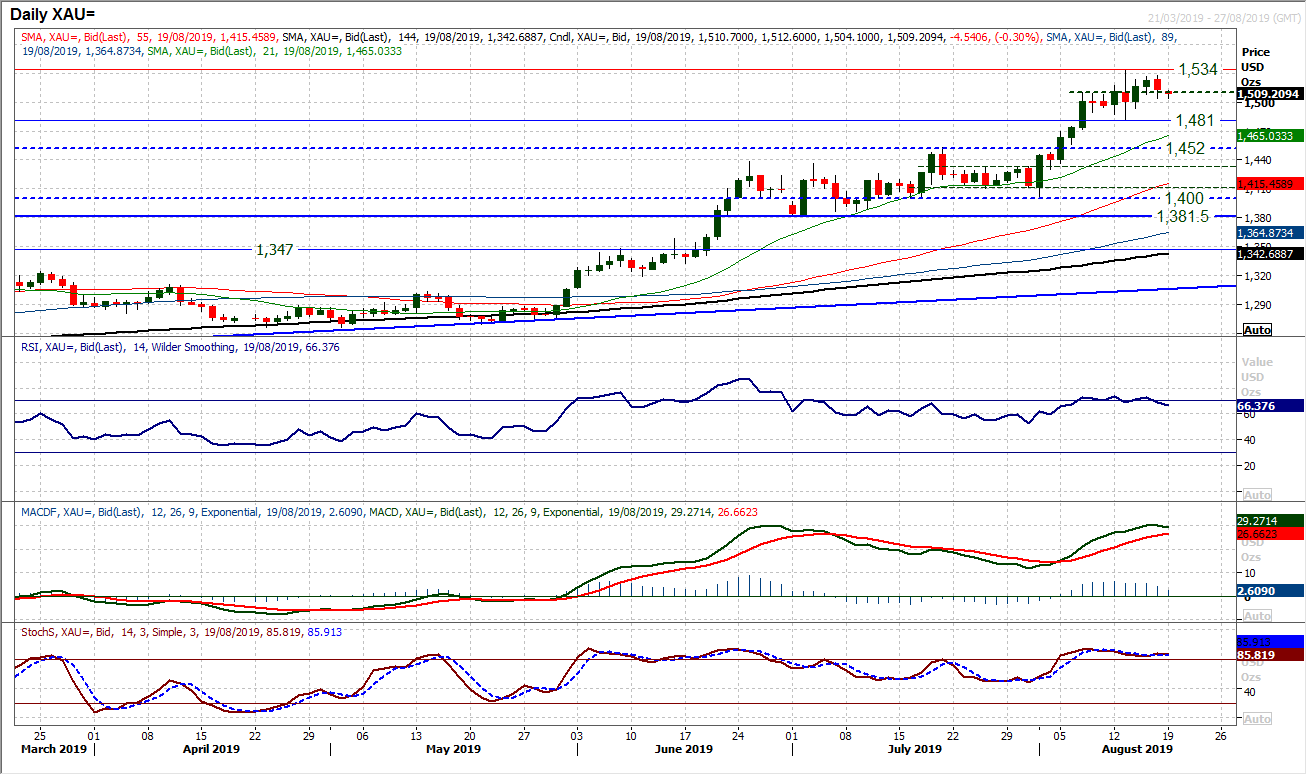
Gold suffered a bit into the close on Friday as the bulls just pulled the reins on the rally. In a move very similar to that of silver, we see this to be simply a near term unwind on gold, rather than the beginning of a new leg lower. However, there is a rolling over on momentum indicators, which reflect a loss of momentum in the rally. The prospect is that this becomes a basis of consolidation now. Dropping back below $1510 just sees the bulls taking a step back and if this drift continues below the $1500 psychological level, there could be some further unwind back towards the recent low at $1481. Hourly momentum has certainly taken on more of a consolidation appearance, with the hourly RSI oscillating between 35/65 in the past few sessions, and MACD lines just edging back under neutral again. A closing breach of $1481 would be a small top pattern completion and imply further corrective move, but for now we remain fairly sanguine that this consolidation will remain supported. Resistance at $1527 and the multi-year high at $1534.
WTI Oil
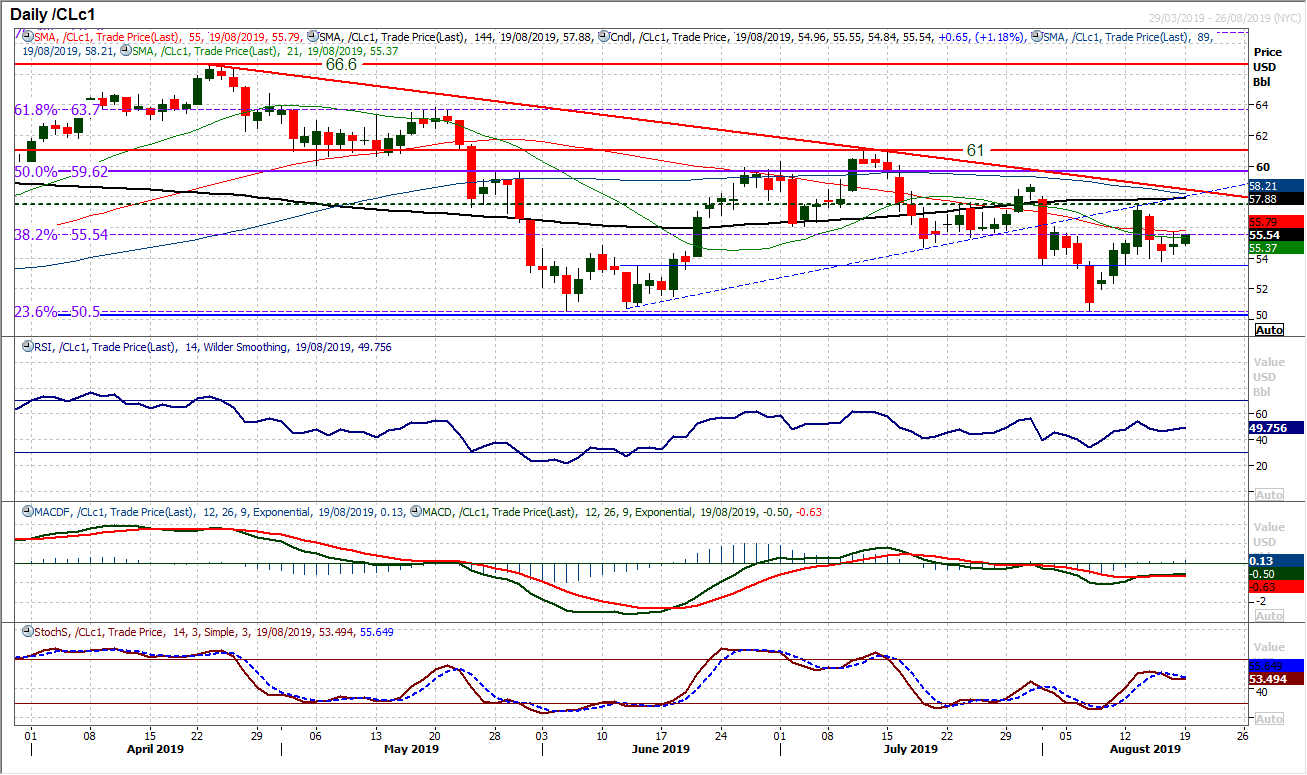
A mild tick higher on Friday and an early degree of buying pressure today is once more seeing the bulls looking to improve the near term outlook. However, WTI remains in this sequence of lower highs and lower lows, meaning that unless last week’s high of $57.25 is breached then this is simply another chance to sell. This is reflected through the momentum indicators which retain a negative medium term configuration. RSI is struggling consistently between 50/60, whilst MACD lines are drifting below neutral and Stochastics have again rolled over. The old 38.2% Fibonacci retracement at $55.55 is a gauge of initial resistance, but we continue to expect rallies to falter and pressure to resume lower. The hourly chart shows a basis of support $53.75/$54.00 and how the market responds to mild gains today could be a telling gauge for sentiment now.
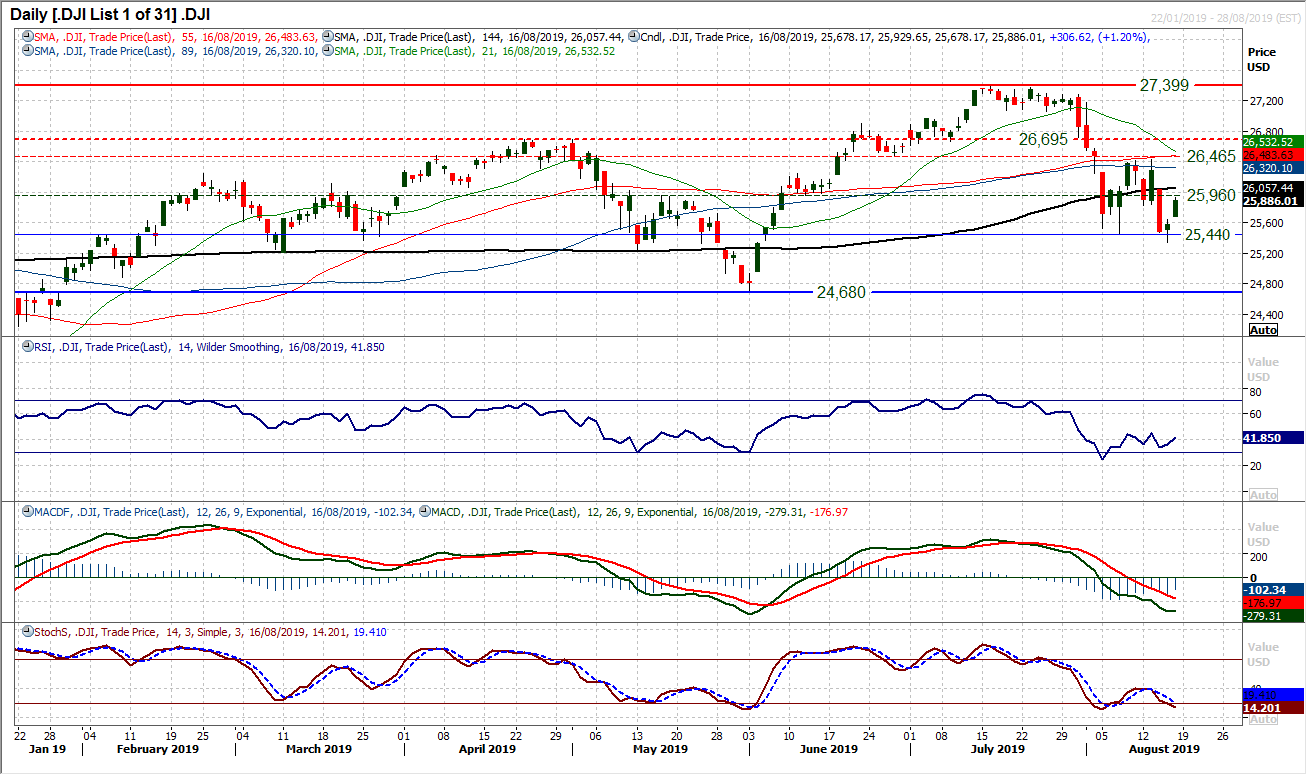
In the past couple of weeks the market has run to and fro, with a wild range of trading between 25,340/26,425. The latest development is a pick up to leave support growing in the range 25,340/25,440 and a solid positive candle for the bulls to work from on Friday. A move above the old pivot at 25,960 would once more re-open the resistance around 26,425/26,465. It is interesting to see that whilst this wild moves higher and lower of the past two weeks have occurred, there is a more stable look to momentum, where the RSI is steadying above 30 and MACD lines are shallowing out. There is still the medium term negative bias (RSI and Stochastics failing below 50) which would point towards selling into strength on balance, however, the outlook is now far less decisive. This negative bias is also reflected on the hourly chart indicators, and whilst the resistance 26,425/26,465 remains in place it is difficult for the bulls to really get real confidence. A run of solid positive candles would certainly help though.
"""DISCLAIMER: This report does not constitute personal investment advice, nor does it take into account the individual financial circumstances or objectives of the clients who receive it. All information and research produced by Hantec Markets is intended to be general in nature; it does not constitute a recommendation or offer for the purchase or sale of any financial instrument, nor should it be construed as such.
All of the views or suggestions within this report are those solely and exclusively of the author, and accurately reflect his personal views about any and all of the subject instruments and are presented to the best of the author’s knowledge. Any person relying on this report to undertake trading does so entirely at his/her own risk and Hantec Markets does not accept any liability. """
