Market Overview
Since Donald Trump announced the intention to ramp up trade tariffs on China again, there has been a significant shift in outlook across markets. Safe havens continue to perform strongly, with the yen, Swissy and to a slightly lesser extent, the euro, all stronger. Gold has broken to multi-year highs again early today. On the flipside, the higher risk commodities currencies, of the Canadian, Australian and New Zealand dollars are all key underperformers. However, the most decisive mover has come with the weakness of the Chinese yuan, which has today weakened massively to break through a crucial level of 7 to the US dollar. This has been seen as a key floor for the yuan and given how the market has just kept going today, it is a big move which points towards Emerging Asia struggling with the escalation with the trade dispute. Even though the US 2 year Treasury yield has dropped over 30 basis points in less than four sessions (as the market prices in for more aggressive rate cuts from the Fed), we still see the yuan hugely weaker, something that will be a big red warning light for markets. The PBoC will have to respond, most likely with both fiscal and monetary easing, but the longer this move continues, the bigger the move into safe haven assets.
Wall Street has continued its slide, with the S&P 500 -0.7% at 2932, with US futures another -1.0% lower early today. Asian markets have been hit hard overnight, with the Nikkei -2.0% and Shanghai Composite -1.0%. In Europe, the outlook is little different, with FTSE futures -1.0% and DAX futures -1.3%. In forex, there is a continuation of the safe haven bias that ended last week, with JPY and CHF being key outperformers, along with EUR gains. Furthermore, GBP is struggling again, along with AUD and NZD. In commodities, gold has smashed to multi-year highs and is over 1% higher, whilst oil is seeming rolling over again on the risk aversion.
The services PMIs are the big focus for markets on the economic calendar today. First up the final Eurozone Services PMI at 0900BST which is expected to be unrevised from the flash reading at 53.3 (53.3 flash July, 53.6 final June). The Eurozone Final Composite PMI is also expected to be unchanged from the flash reading with 51.5 in July and confirm the deterioration from the previous month (51.5 flash July, 52.2 final June). The UK Services PMI is expected to remain at 50.2 in July which comprising around 80% of the economy would suggest the UK continues to stagnate (50.2 in June). The US ISM Non-Manufacturing PMI is at 1500BST and is expected to improve to 55.5 in July (form 55.1 in June) reflecting the ongoing US economic relative outperformance.
Chart of the Day – USD/CHF
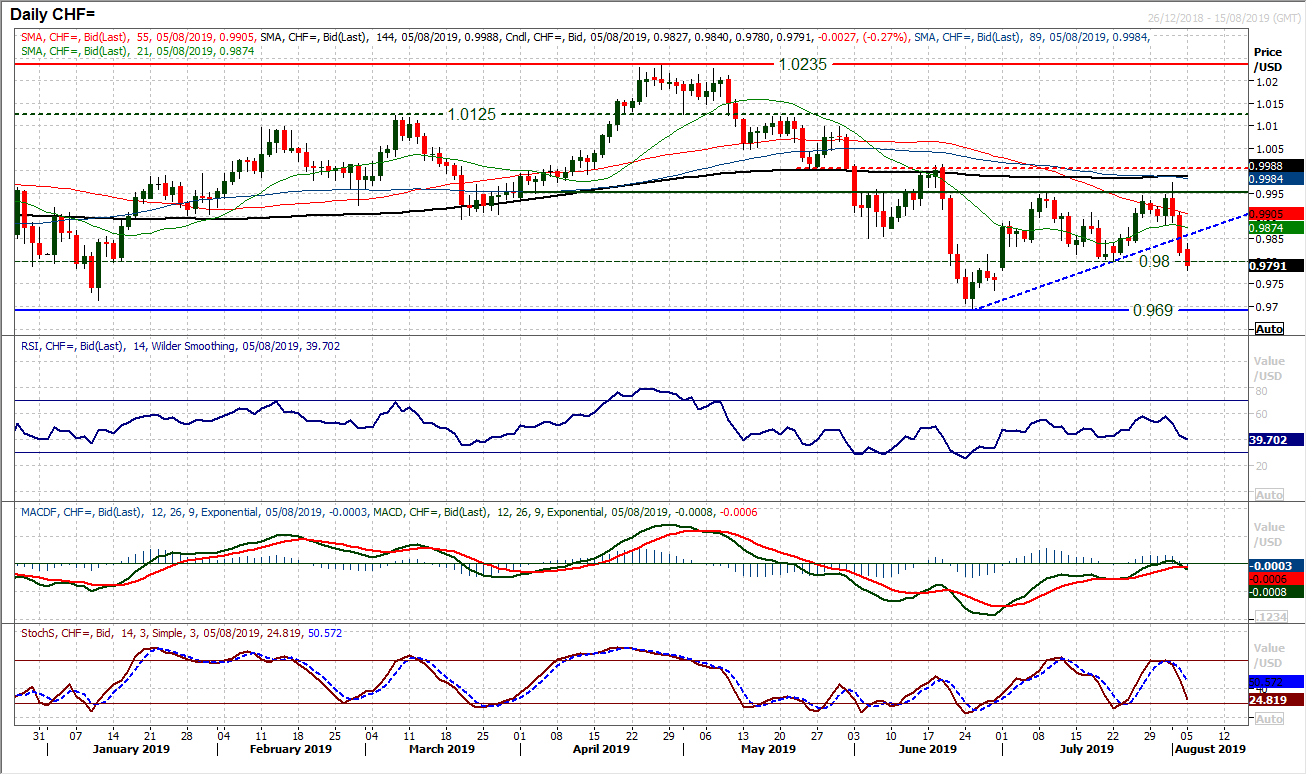
The Swiss franc has had a strong run of sessions. These have been sessions which have signalled a key deterioration in the outlook against the euro, but there has also been strength against the dollar too. Dollar/Swiss completed a second decisive bear candle into the close on Friday to breach the support of a five week uptrend. This is now being followed early today with further downside to breach 0.9800 which is a key higher low from July. With momentum indicators posting a series of sell signals at key medium term levels, the bears are gathering in force. The Stochastics have posted another bear cross sell signal bang on 80 (where the July sell signal formed) whilst the MACD lines look set to compete a bear cross at neutral. A closing breach of the July low at 0.9800 would be a breakdown which would confirm a shift to a corrective outlook where selling into strength is the strategy. A failure of this support would imply a retreat back to the low at 0.9690 again. The hourly chart shows resistance at 0.9875/0.9900 with intraday rallies now a chance to sell. The overnight rebound high was 0.9840.
The technical analysis of EUR/USD would continue to point towards selling into strength. For six weeks there has been the development of a downtrend with a series of lower highs where the bulls fail to sustain recovery traction. The big breakdown below $1.1100 was a key event, however, the validity of this breakdown has been questioned in the past three sessions as a recovery has set in. We still believe that this near term bounce will struggle for sustainable gains, but certainly for now, the market is tracking higher. The late July failure under $1.1180/$1.1200 support saw an intraday rally fail at $1.1187 (on ECB day) with the market subsequently failing at $1.1162 (on FOMC day). These resistance levels are therefore key. Given the six week downtrend is falling at $1.1200 today, and the falling 21 day moving average (at $1.1180 today) which has capped the gains since early July, the market has considerable resistance to get through to change the outlook. Momentum has ticked slightly higher but is still within the confines of selling into strength. There is a basis of a pivot around $1.1100 which is again a gauge to watch, with the key low now at $1.1025.
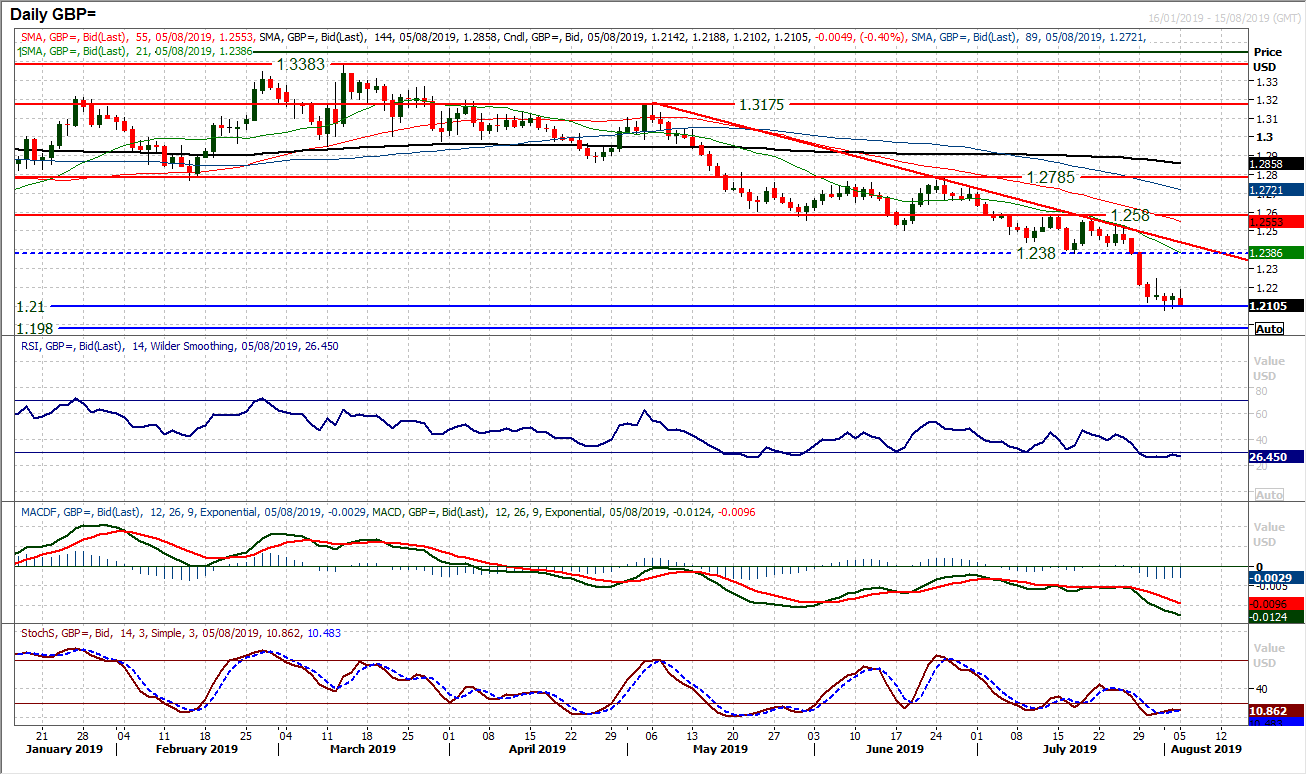
We continue to be worried for sterling bulls. Given the weakness of the dollar versus the euro and the yen in recent days, the fact that Cable has barely moved should be seen as a concern for long positions. It is a market that has shown very little appetite for recovery and we see additional downside as likely. The market is currently bumping along the bottom around $1.2100 which is an old support from March 2017. Even this morning, early gains in Asian trading are being snuffed out. Last week’s low at $1.2077 is an intraday support but a close below $1.2100 would also be another bear signal. Momentum indicators are decisively negatively configured still and continued failure below $1.2250 maintains the negative outlook. Any failed intraday or near term rally under $1.2380 is a chance to sell. A close below $1.2100 opens $1.1980.
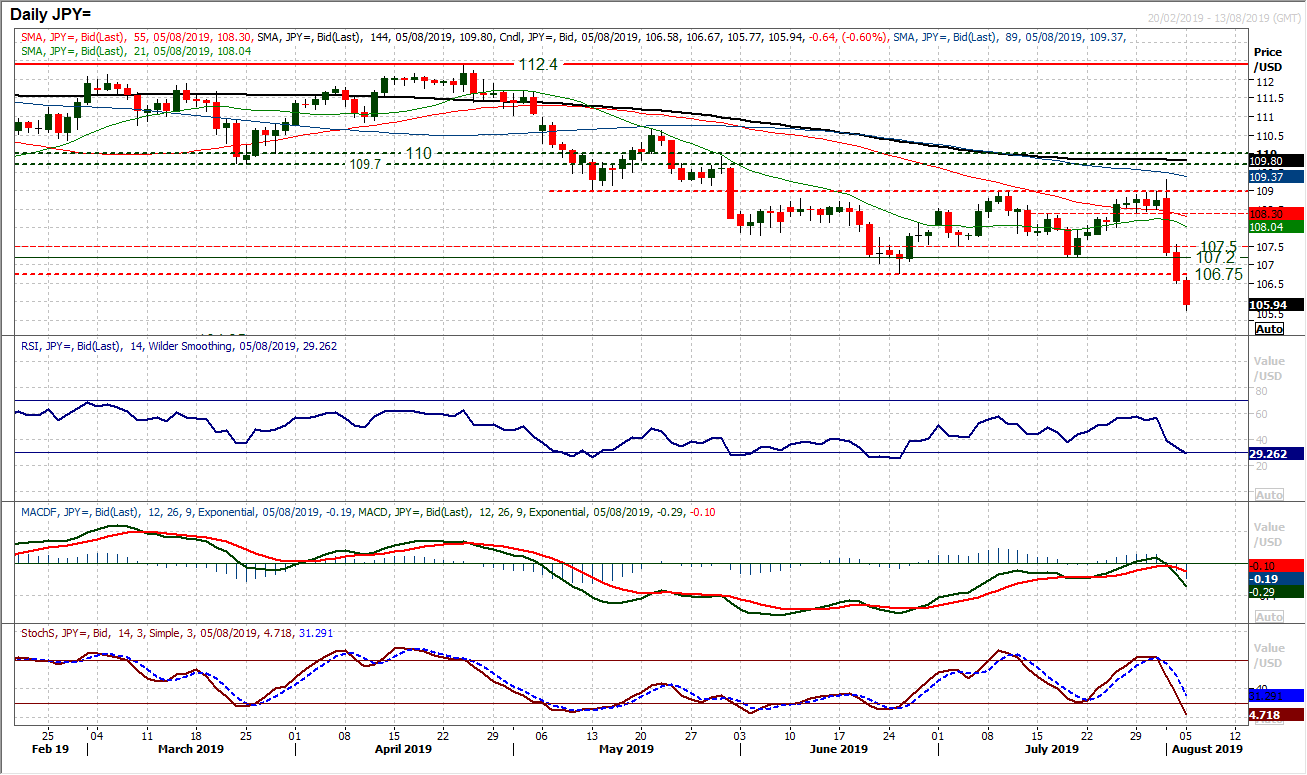
Following such a huge bearish candlestick (from Thursday) with another decisive bear candle to breach key support at 106.75, there has been a significant shift in outlook. A close below 106.75 now puts the market on course for a move back towards 104.50/105.00 in the coming days/weeks. There is renewed negative intent on momentum indicators with a bear cross on MACD lines and Stochastics turning lower. The old support at 106.75 is now a basis of overhead supply to capture intraday rebounds and even today has been a barrier. However, the RSI is negatively configured and momentum is with this sell-off now, so downside targets are open.
Gold
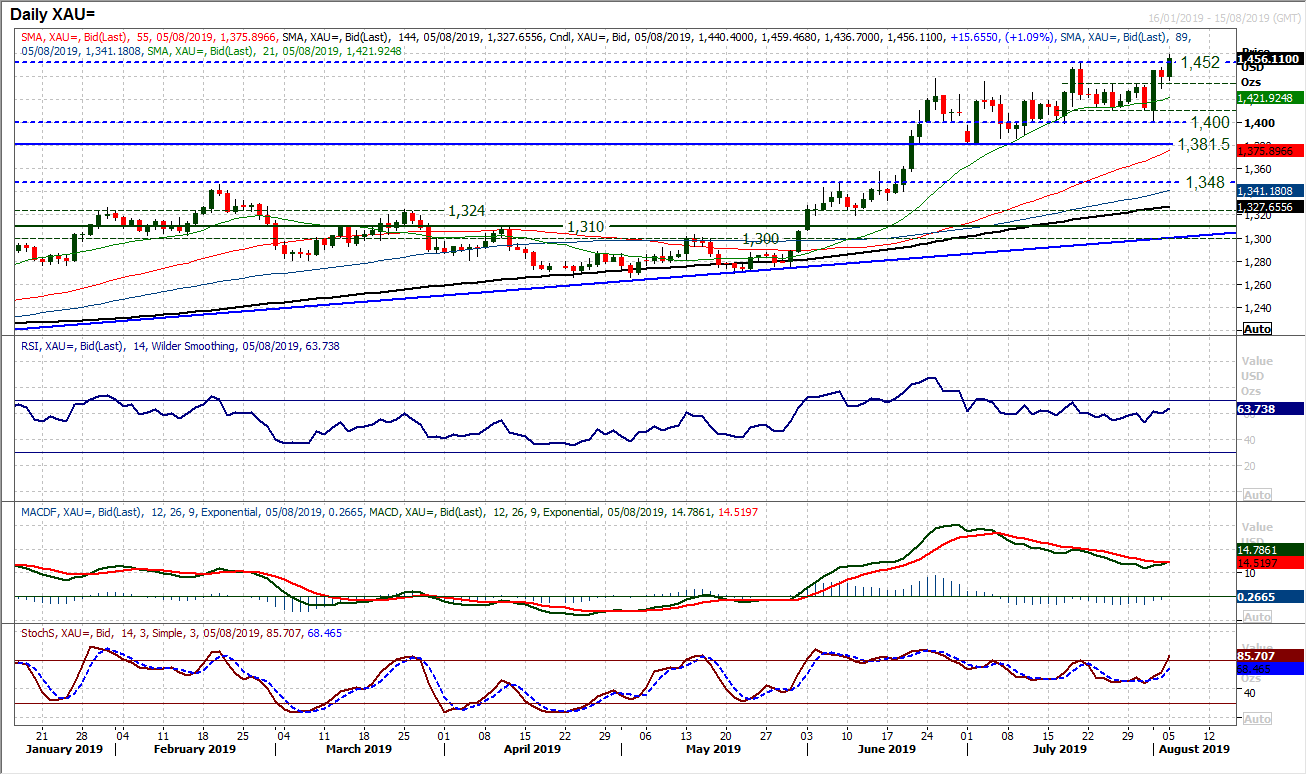
The gold bulls will have come out of Friday’s roller coaster session feeling stronger. This is translating through to early buying pressure today to push the market above $1452 to new multi-year highs. The bulls are using near term weakness as a chance to buy. Using Friday’s intraday low at $1430 the market is building strongly to leave support around the recent breakout of $1433. The improvement coming through on momentum indicators adds to the confident outlook now. The RSI is back above 60 (two week highs), whilst Stochastics are accelerating higher once more and MACD looks poised to turn up. A close above the $1452 multi-year high would open $1488 as a minor resistance but thoughts of the psychological $1500 will be in mind. With the support at $1400 taking an ever growing importance (a growing pivot and last week’s low) the market has left another higher low. It seems as though moves in recent weeks have not been straight line and this suggests that opportunities for the bulls will present themselves. We continue to be buyers into weakness.
WTI Oil
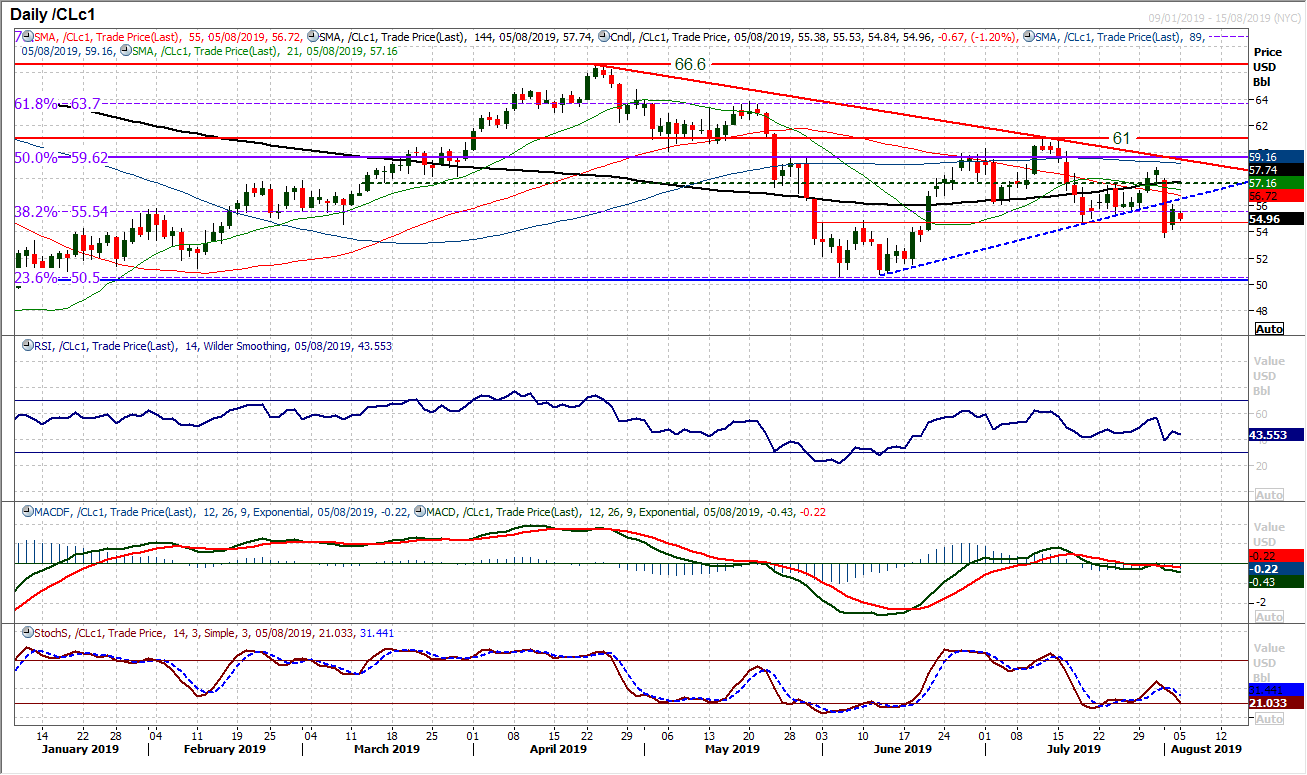
The chart of WTI is still dominated by the huge bear candle from Thursday. Even though the market rebounded impressively on Friday, this still looks to be a chance to sell. Momentum indicators are tracking lower with downside potential. The rebound on Friday seems to be failing at the underside of the old seven week recovery trend. Also failure is around the old 38.2% Fibonacci retracement at $55.55. A renewed negative candle today with a close under the old July low at $54.70 would suggest the bears are gathering momentum again. We expect a retest of last Thursday’s low at $53.60 to be seen in due course and if that were to fail then the $50.70 low from June is wide open again. Resistance is now under $56.05 which is Friday’s high.
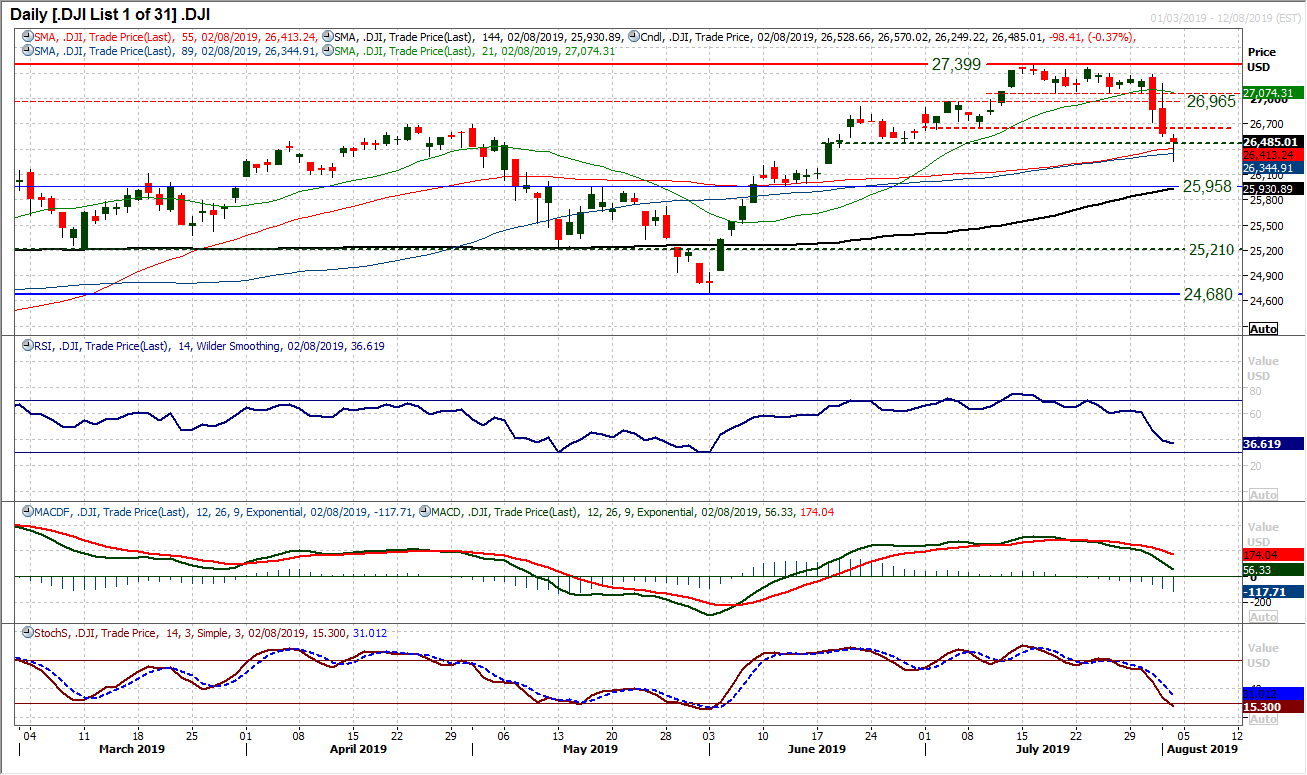
Wall Street remains under pressure as the Dow has closed in negative territory for a fourth consecutive session. Although the selling pressure may not have been as great on Friday (closing well off the day low), the market is now consistently breaching supports and the bears remain in control. An acceleration lower on momentum indicators may just be slowing a touch, but the corrective outlook is still in force. Breaching 26,665 was a key moment and this is now a basis of resistance overhead. Intraday rallies are a chance to sell. Expect further downside pressure to test Friday’s low at 26,250 whilst the market is on course to test the old pivot line at 25,960.
"""DISCLAIMER: This report does not constitute personal investment advice, nor does it take into account the individual financial circumstances or objectives of the clients who receive it. All information and research produced by Hantec Markets is intended to be general in nature; it does not constitute a recommendation or offer for the purchase or sale of any financial instrument, nor should it be construed as such.
All of the views or suggestions within this report are those solely and exclusively of the author, and accurately reflect his personal views about any and all of the subject instruments and are presented to the best of the author’s knowledge. Any person relying on this report to undertake trading does so entirely at his/her own risk and Hantec Markets does not accept any liability. """
