Risk is bid again: Stocks rallied for a second day this week with European bourses making gains in early trade Tuesday after a solid day on Wall St and another good handover from Asia in the wake of the FDA’s full approval of the Pfizer (NYSE:PFE) jab, whilst markets seem to found their safe space regards Delta after last week’s wobble. European stocks maybe also got a slight boost as data showed the German economy grew faster than expected in the second quarter. Nevertheless, the Bundesbank cautioned on Monday that the Delta variant could see the country miss full-year growth estimates.
Gains in early trade come off the back off record highs on the Nasdaq, while the S&P 500 is called to open at a fresh all-time high later today. The FDA’s full approval of the Pfizer-BioNTech vaccine boosted shares in both companies, with the latter rallying over 9% in Frankfurt, whilst PFE was up almost 3% in New York. Moderna (NASDAQ:MRNA) also rose 7%. The decision – which should increase vaccination rates in the US – helped cement the risk rally started in Asia and which followed through the European session and into the New York open.
Reopening stocks like the cruise operators did well as markets bet it means more vaccines and an easier path for companies to make them mandatory. It’s also evident that booster shots will be rolled out in many countries.
Energy stocks led the charge as oil prices rallied over 6% at one point, snapping a 7-day losing streak. Growth/ large cap tech/ momentum provided a solid back up, with Apple (NASDAQ:AAPL) and Facebook (NASDAQ:FB) both +1%, Tesla (NASDAQ:TSLA) +3%.
Keep your eyes on On Holding, a running shoemaker backed by Roger Federer. The company filed for an IPO in New York, looking at a valuation of $6-8bn after it said net sales had risen by 85% in the first half of the year. It’s said to be in more than 8,000 shops worldwide and with the Federer name backing it has a powerful brand image to lever.
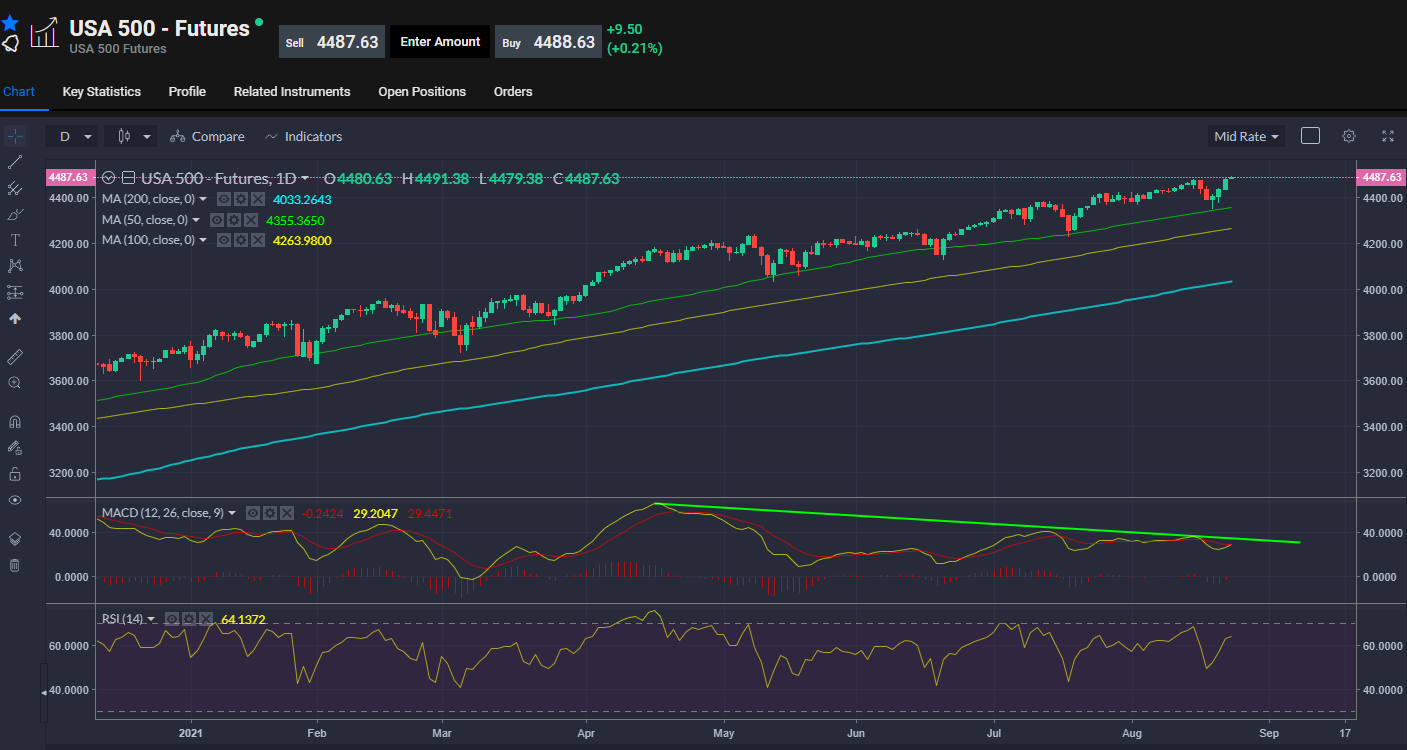
Last week’s wobble hardly registered on the Richter scale – a test of the 50-day for S&P futures, almost, proving enough to get dip buyers back in the hunt. Watch the long-term MACD divergence on the daily, though we could be about to see a bullish crossover.

But despite the gains in the market, the macro data keeps telling us we are well past peak growth, albeit traders are looking at a reignition of the reflation/reopening trade in September. The headline from yesterday’s PMI report for the UK economy said it all, and nothing we didn’t know already: Recovery loses momentum as supply constraints hit output growth in both the manufacturing and service sectors. The composite output index slumped to a 6-month low, with constraints on growth stemming from supply chain problems and staff shortages. Some will blame Brexit, and it may be a factor, but this is being seen everywhere in the developed world as countries rebuild post-covid. IHS Markit said incidences of reduced output due to shortages of staff or materials were x14 higher than usual and the largest since the survey began in January 1998. And just as in Europe, although there may be a sign of inflationary pressures easing from Jun/Jul peaks, higher wages due to the tightness in the labour market and severe shortages of raw materials continue to be a major problem.
US PMI data also slowed and missed expectations. The report showed the third month of declining momentum and prices keep going up, with the twin drivers of supply chains and staffing to blame.
- Services input prices 73.5 vs 72.3 prior
- Manufacturing input prices 88.4 vs 86.7 prior
- Composite input prices 75.9 vs 74.6 prior
But slowing momentum in the economy could just keep the Fed from getting too hawkish, which stock markets would certainly prefer. Stickier inflation makes it harder for the Fed to stay easy for too long – the FOMC is in a bind, and we won’t know if this is a policy mistake for some months. Declining momentum in the economic data would favour a more dovish response from the Fed. Past peak growth, past peak Delta variant worries all we can do is wait for the Fed to tell markets where to go.
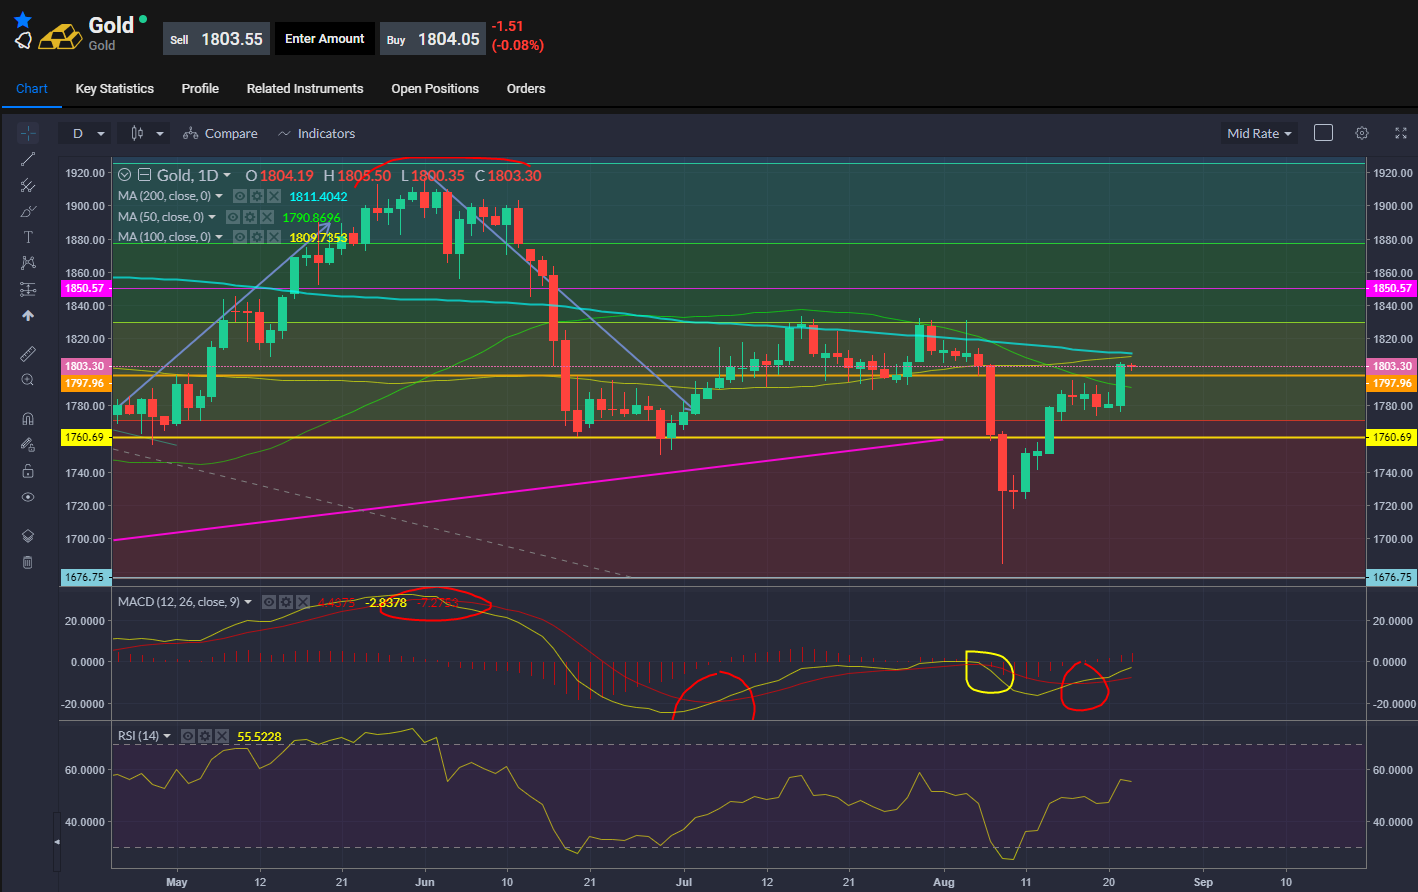
Stickier inflation helping Gold to maintain momentum towards the $1,800 area where we look for a possible bullish 100/200day crossover to follow up the bullish MACD.

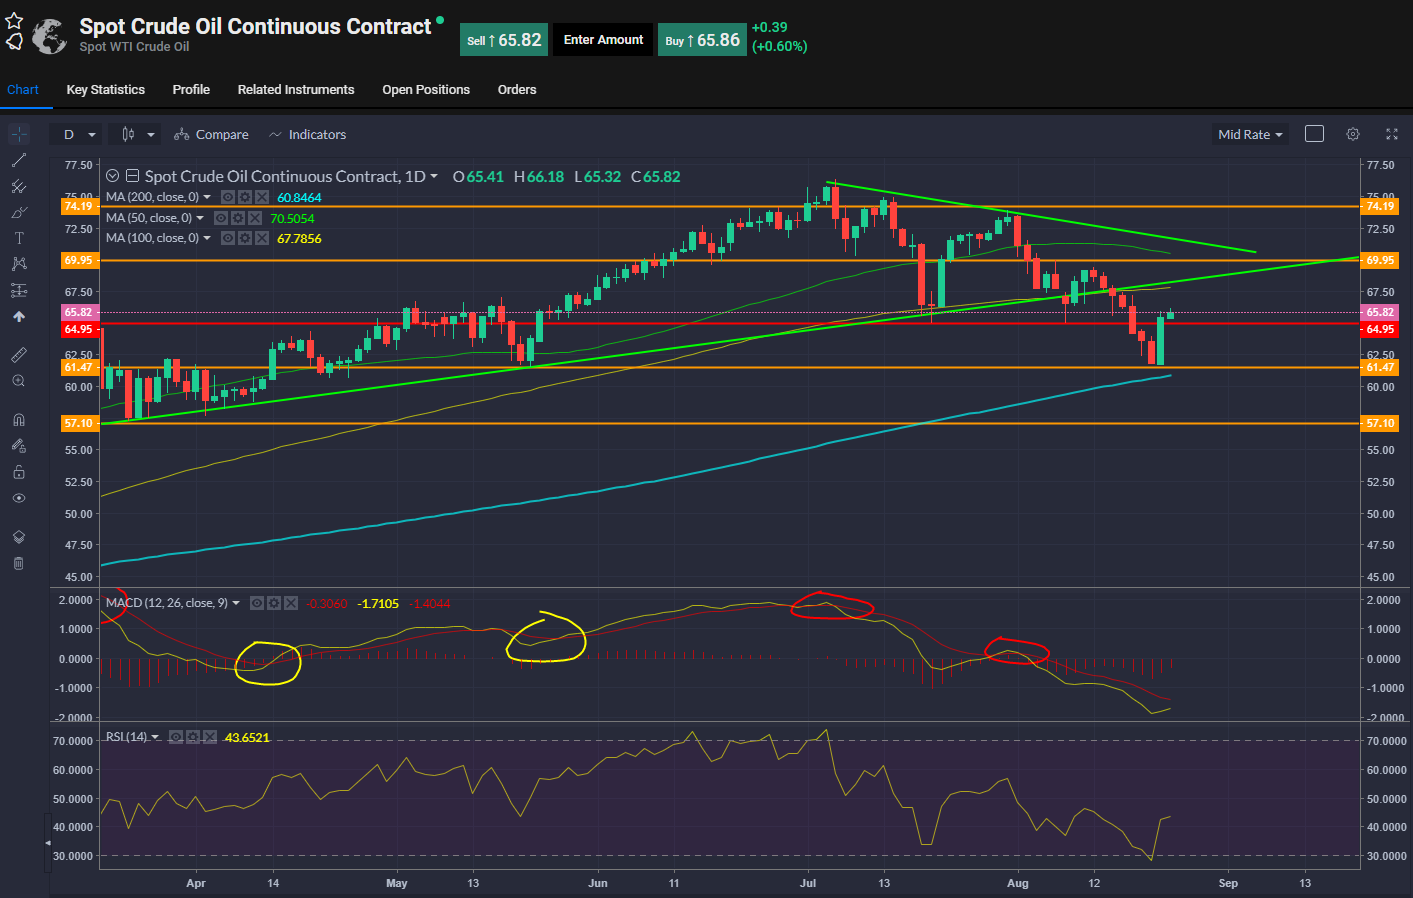
Oil rebounded sharply – big outside day reversal rejecting the May low suggests bulls have wrestled back control. Monday’s over 5% jump for WTI saw it snap its worst run since 2019. Although there are still big worries about demand – the market seems to be saying that the recent selling was overdone. GS analysts on Monday argued that steadily tightening markets will overcome macro trends like Delta variant worries to push prices to a new cycle high in the autumn. They are similarly bullish for base metals.

