Market Overview
The mood of optimism surrounding the expected move towards “phase one” of a US/China trade deal has turned increasingly wary in recent days. Trump’s speech on Tuesday hardly showed the way forward, opting instead to go on the offensive in his rhetoric. Now it seems that a “snag” has been hit. Suggestions are that China are concerned over the one sided nature of the deal given the significant increase in agricultural purchases (doubling to around $40bn/$50bn per year).
China are looking for get out clauses should relations sour again. This is driving market flow back into safe haven assets. A decline in Treasury yields has seen US 10 year Treasury yield -10bps off last week’s rebound high. It is difficult to see the rally on equity markets continuing if yields continue to fall. In the forex space, the Japanese yen and Swiss franc are again outperforming, whilst higher beta commodity currencies are pressured. Adding to this caution today we see China data missing estimates across the board as Industrial Production and Retail Sales growth both continue to slide. On a lighter note, German growth beat estimates today as Q3 grew +0.1% and the country narrowly avoided moving into technical recession. Is this enough to change the mood of caution though? With all eyes on US/China trade, probably not.
Wall Street managed to squeeze out marginal gains yesterday with the S&P 500 +0.1% at 3094, but US futures are again on the back foot early today -0.2%. Asian markets were mixed with the Nikkei -0.8% and Shanghai Composite +0.2%. The European markets are looking more cautious, with FTSE futures and DAX futures both around -0.1% lower.
In forex, there is very much of a risk averse bias with JPY outperforming along with a strengthening CHF and USD. The two big stragglers are AUD and NZD.
In commodities, gold is finding support again, whilst oil has built further on yesterday’s rebound, adding another half a percent on suggestions of slowing future US shale supply growth.
It is another packed day of data on the economic calendar. UK Retail Sales (ex-fuel) is at 09:30 GMT which are expected to show +0.2% monthly growth in October which would improve the year on year growth to +3.4%. Eurozone flash GDP is at 10:00 GMT which is expected to show quarterly growth of +0.2% in Q3. Later in the session, US PPI is at 1330GMT and is expected to show factory gate pricing pressures reducing, with headline PPI falling to +0.9% YoY (from +1.4% in September), whilst core PPI is expected to drop back to +1.5% (from +2.0%).
It is the second day of Fed Chair Powell’s testimony to Congress and the turn of the House Budget Committee at 1500GMT. As yesterday, Powell’s written testimony is followed by a series of questions. There are also four other Fed speakers to watch for today, all of which have a say in monetary policy. Vice Fed chair Richard Clarida (permanent voter, mild dove) is at 14:10 GMT along with Charles Evans (voter, mild dove). Then at 1700GMT John Williams (NYSE:WMB) (voter, mild dove) speaks, before the former dissenter James Bullard (voter, dove) at 1720GMT.
Chart of the Day – German DAX
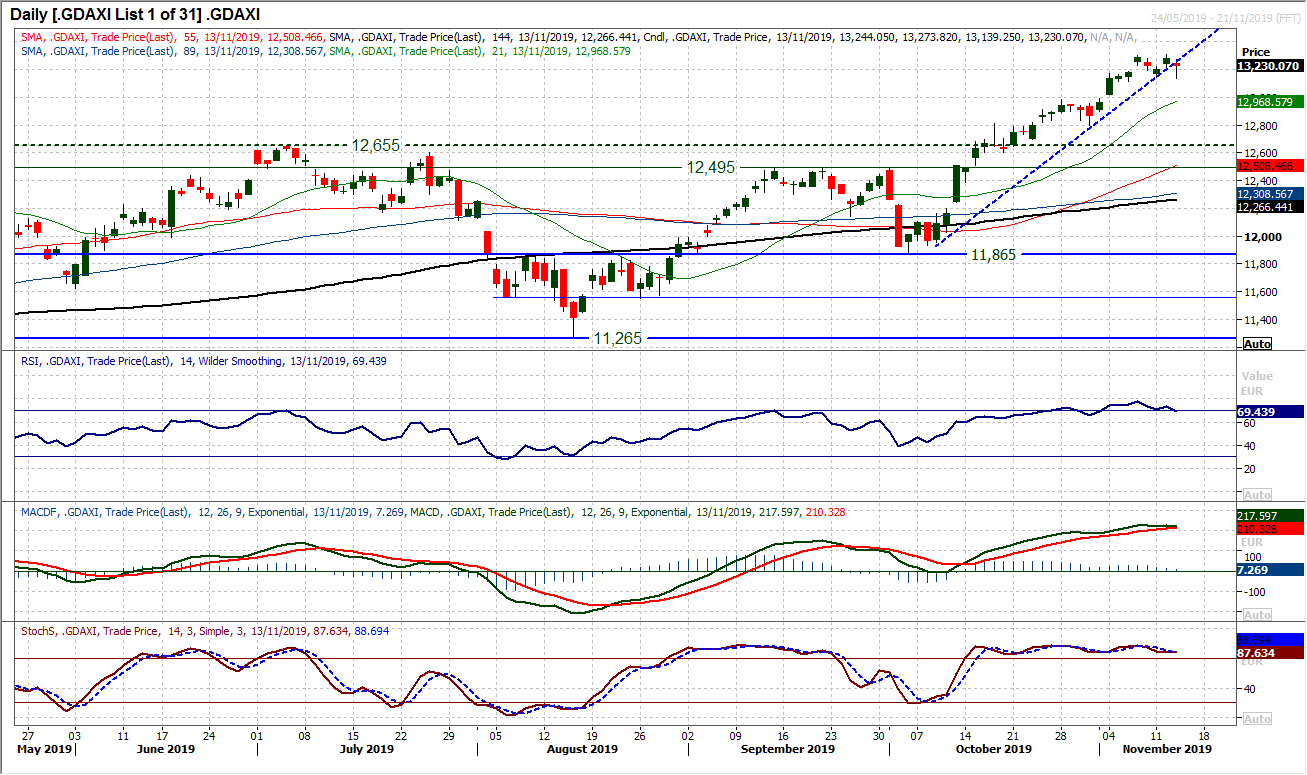
After a near unchecked bull run of the past six weeks, the rally on the DAX is suddenly looking on more shaky ground. An intraday decline yesterday broke a five week uptrend and momentum indicators are threatening to roll over. An intraday breach of 13,144 could not be sustained into the close, but the sellers are testing the water now. A MACD bear cross is threatening, and the last two (in July and September) were the precursor to a corrective phase. RSI is also turning back from above 70, meaning a move below 60 would be a bearish confirmation now. It is interesting to see trading volatility is around key lows (c. 95/105 ticks on the Average True Range), which is consistent with market highs in recent months. Yesterday’s candlestick is an uncertain move (closing well off the low, but still negative on the day) but should serve as a warning for the bulls. The recent resistance at 12,300/12,308 needs to be breached to regain positive momentum. However, there is no getting away from the potential for profit taking which is growing now. A close under 13,144 would open a corrective move back into 12,795/12,985 support.
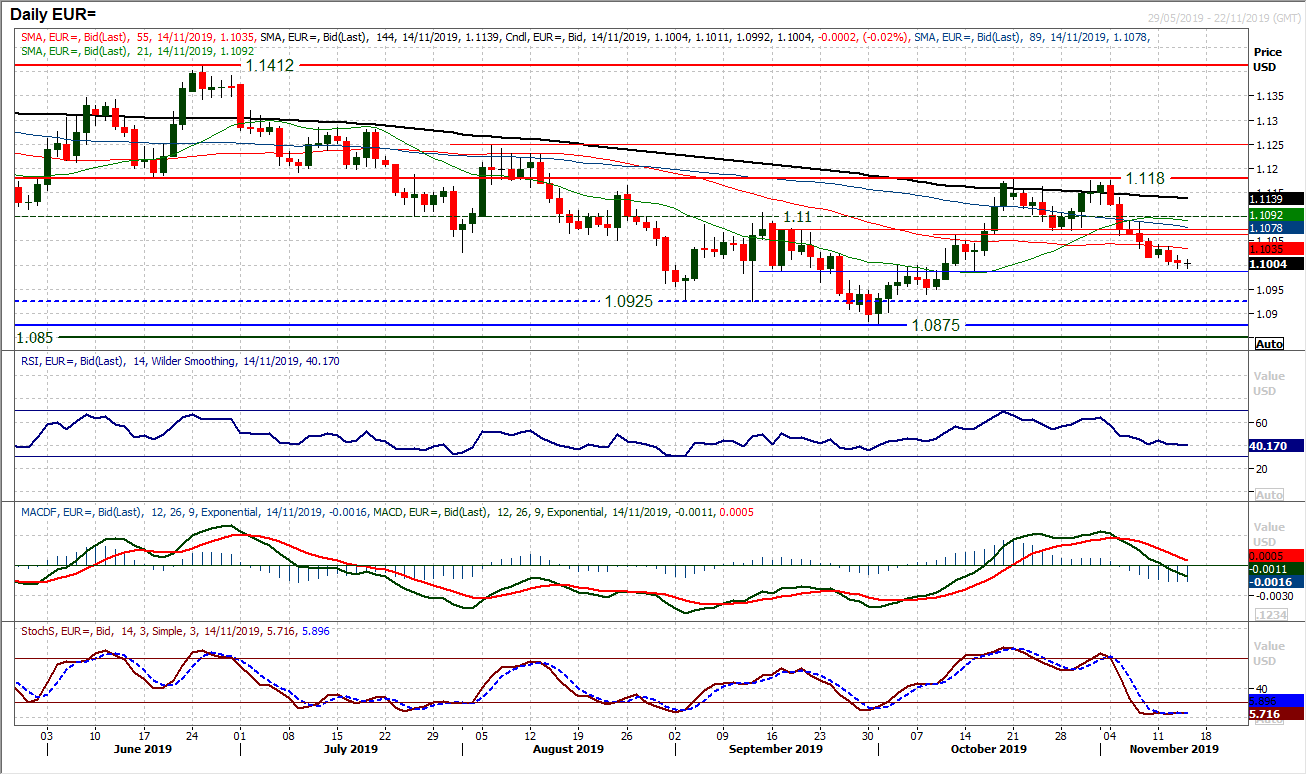
The euro continues to slip lower as the corrective move of the past couple of weeks pulls the market now under $1.1000. The support around $1.0990/$1.1000 is a key gauge that if gives way would open the lows around $1.0925 and the key medium term support at $1.0875. We were discussing the RSI moving below 40 and MACD lines below neutral yesterday and this seems to be developing now. If this were seen as the market closed under $1.0990 it would be confirmation that a decisive corrective move was pulling EUR/USD lower. The consistent run of lower daily highs continues (now the past seven sessions) meaning that yesterday’s high of $1.1020 is initial resistance to watch. The hourly chart shows this as a pivot under $1.1040 as this week’s resistance. Support under $1.09090 comes in at $1.0940 now.
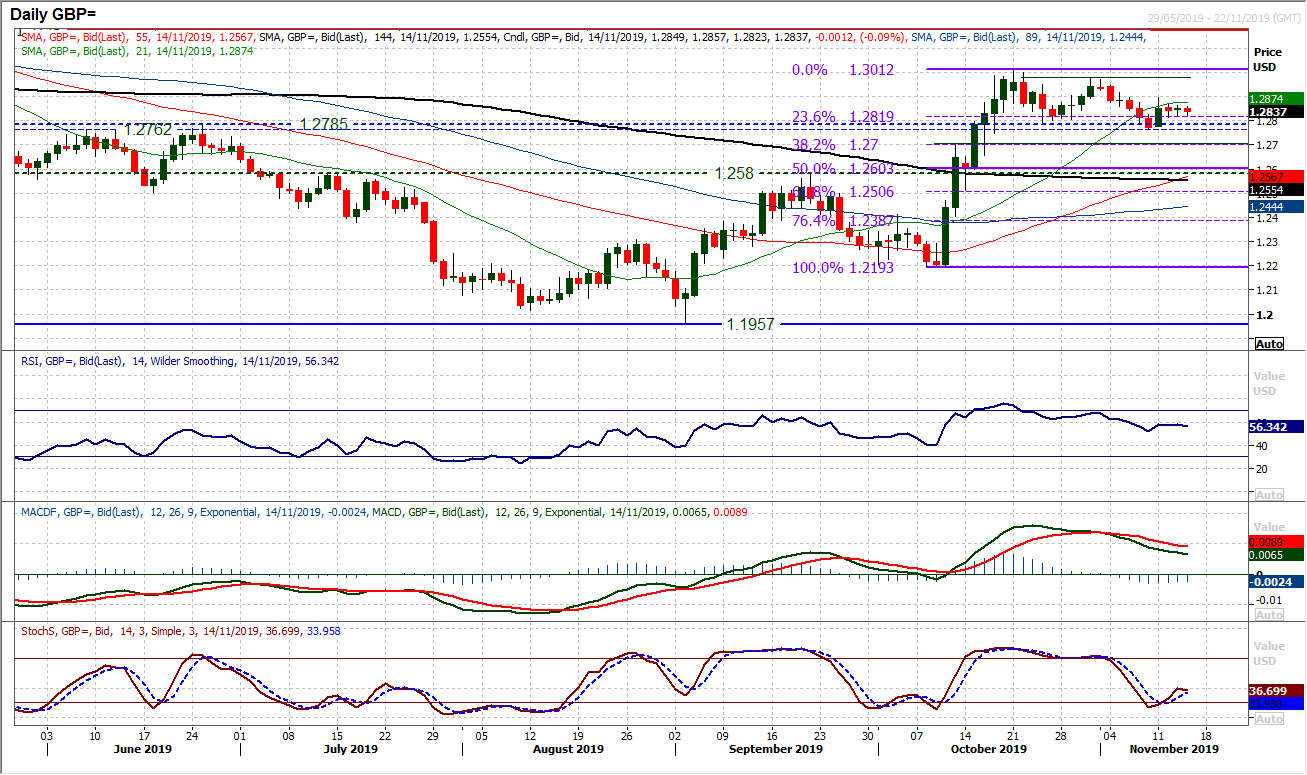
With the positive momentum of Monday’s spike higher (once more on UK political developments) now easing, a negative drift is taking hold on Cable again. This comes with the gradual retracement of the 800+ pip October rally. The 23.6% Fibonacci retracement (of $1.2193/$1.3012) around $1.2820 is again the pull on the market, however, this marks the top of a support band $1.2760/$1.2820 which we see as being tested now. Breaching 23.6% Fib opens 38.2% Fib at $1.2700. The resistance is building at $1.2900 as a lower high potential under $1.2975. The hourly chart shows a mild consolidation in the past couple of days but under $1.2815 would open the downside tests.
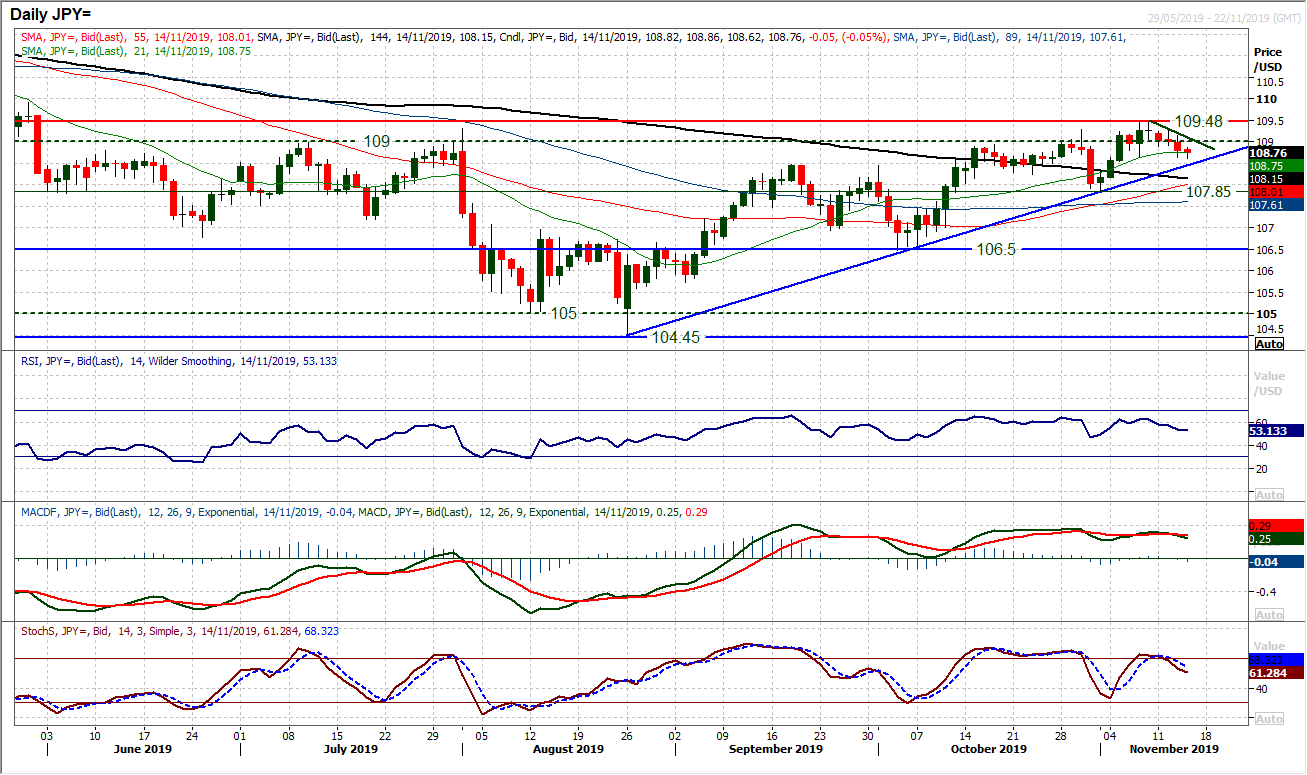
A recent run of neutral to negative candlesticks have once more questioned the ability of the bulls to drive a breakout forward. The failure to stamp their authority following the move above 109.00 must be seen as a concern, especially given the lack of conviction in momentum. Now with an intraday breach of 108.65 (a higher low from mid-last week) sees focus turn squarely on the 11 week uptrend. (today at 108.45). However, there is an increasing deterioration in momentum with the Stochastics crossing lower, MACD lines slipping and RSI also falling. This is all confirmed though the hourly chart where the market is trading below a clutch of falling moving average, and hourly momentum turns increasingly corrective. There is now resistance building up between 108.90/109.15 as the near term run of lower highs builds. A closing breach of 108.65 and subsequently below the 11 week uptrend opens the key support at 107.90.
Gold
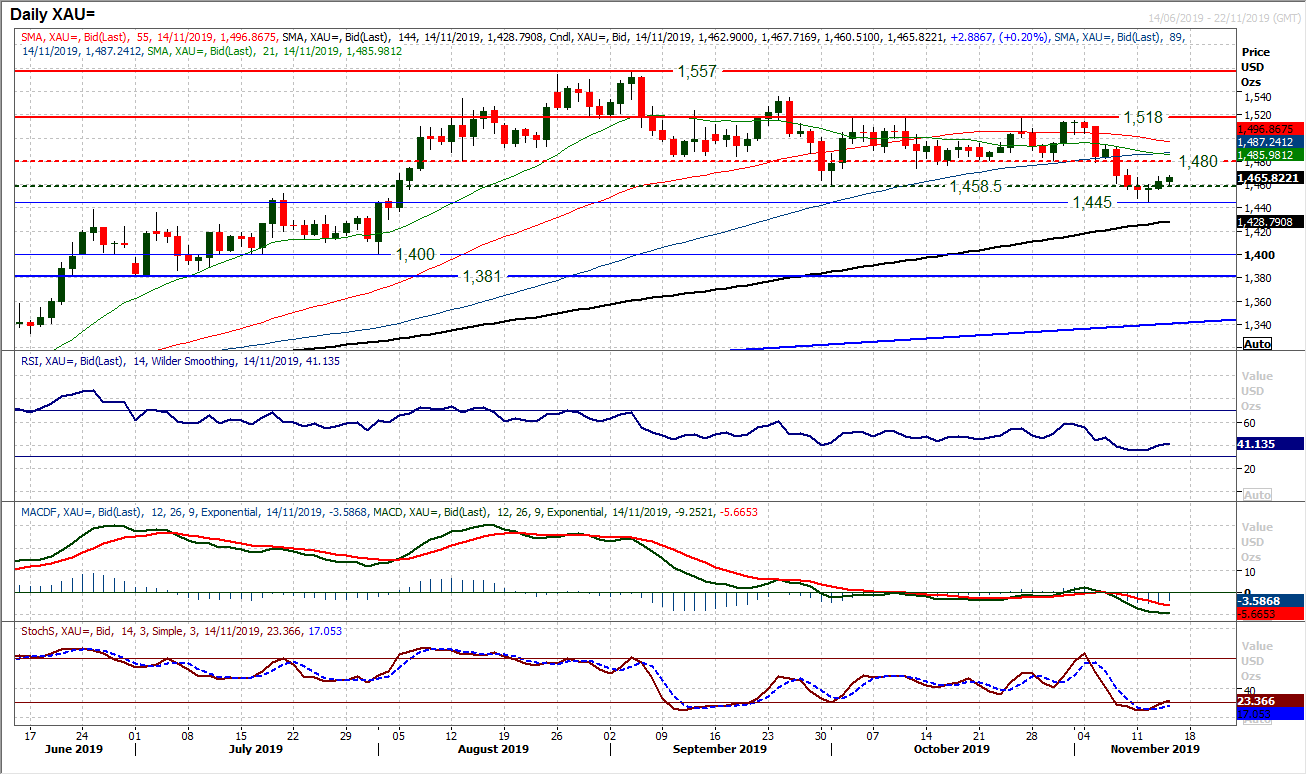
Having seen a downside break of the key October low and support at $1458, the market is engaging in a technical rally. Is this a false downside break? We do not believe so. The confirmation breakdown on momentum (RSI hitting its lowest since August 2018) and growing negative configuration on MACD. The very mild nature of the recovery also hints at a very indecisive rally (false downside breaks are often met with sharp retracements). We see a tentative rally perhaps drifting into resistance of overhead supply $1474/$1480. However, a failing of this rally is likely and any renewed sell signal would be an opportunity to retest the recent low at $1445 and lower. The hourly chart shows the market is in near term recovery mode now and $1458 seems to be a basis of support above $1445. It would need a move above resistance around $1494 to suggest legs in a rebound.
WTI Oil
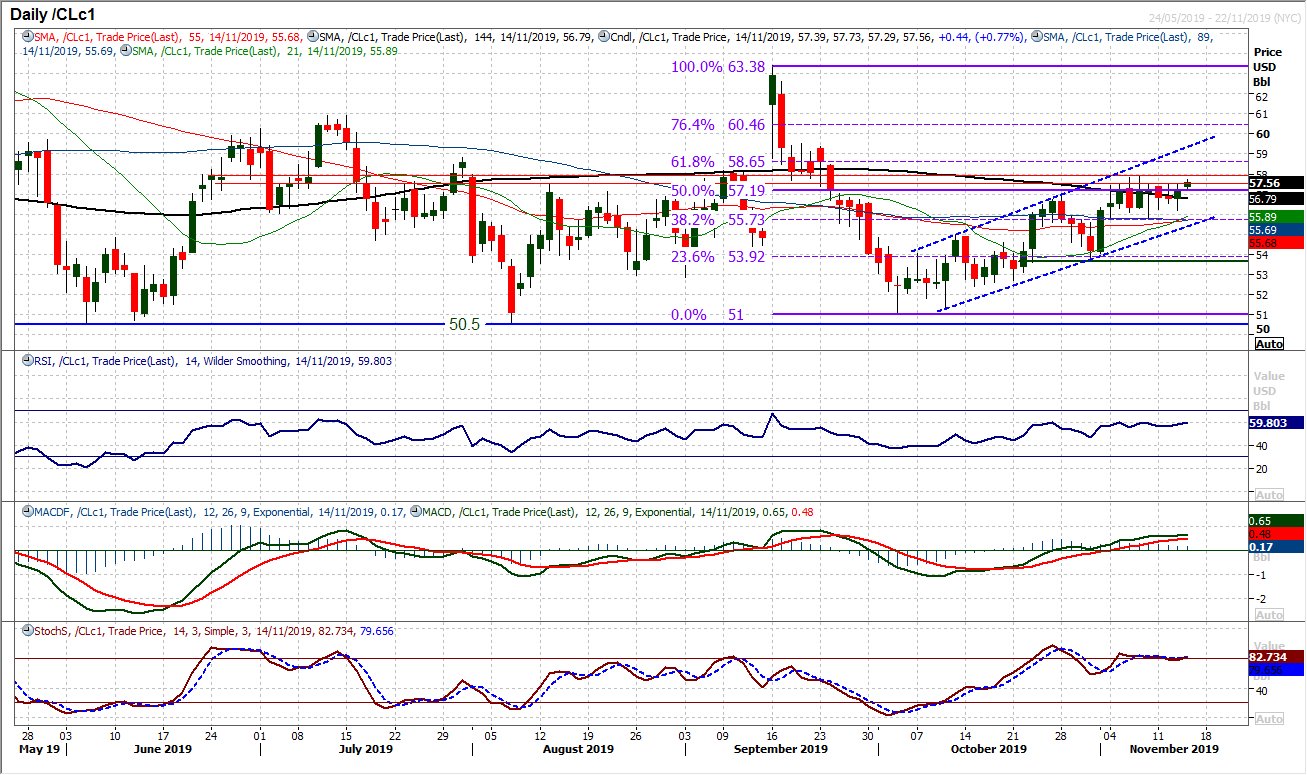
A positive response from the bulls to early weakness yesterday maintains the positive outlook within the trend channel and with WTI as a buy into weakness. Once more the market has returned to trade around the 50% Fibonacci retracement (of $63.40/$51.00) at $57.20. However, more importantly is the test of near term resistance at $57.85 which has been restrictive for the past couple of weeks. A breakout would re-open the recovery potential again. The 61.8% Fib is at $58.65 whilst the top of the channel is at $59.40 today (which coincides with the next price resistance). The support at $55.75 is strengthening further with a band $55.75/$56.20. Momentum remains positive, and seeing the RSI into the 60s would confirm the bulls getting going again.
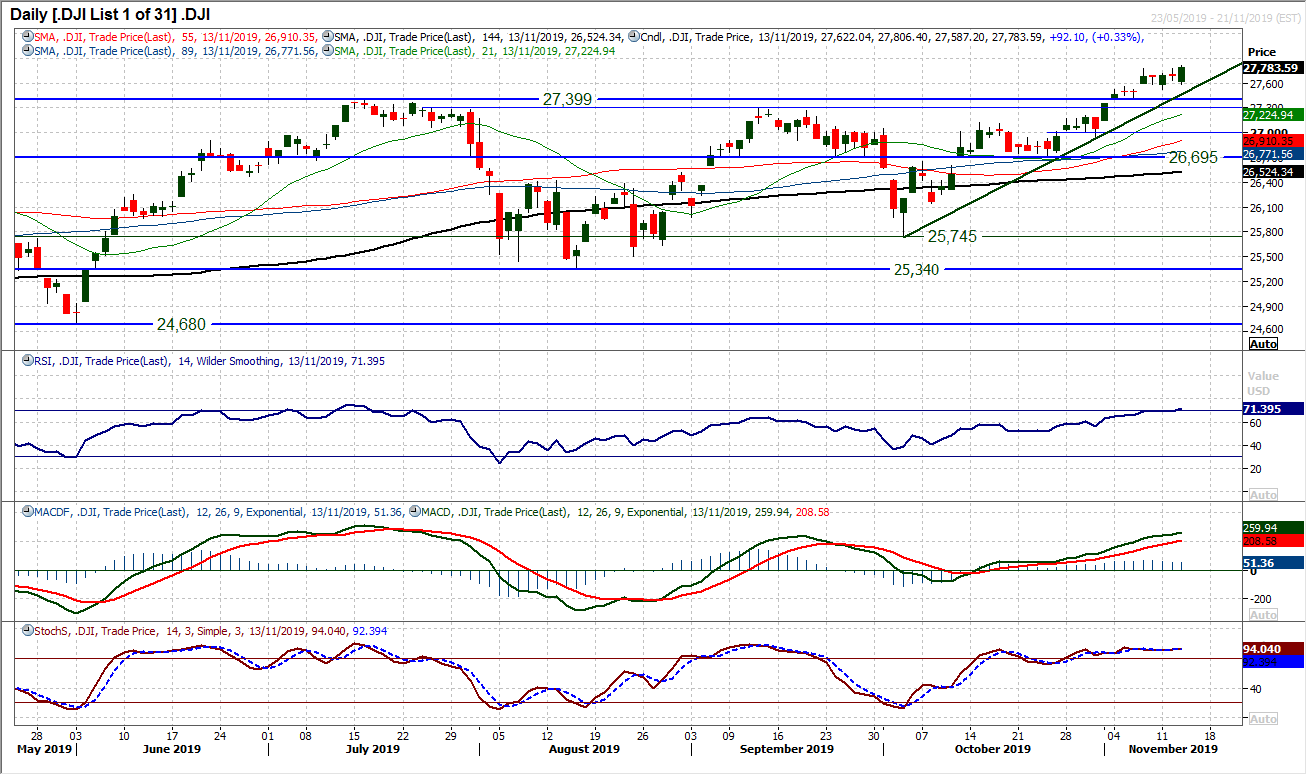
The corrective signals that are threatening on other major equity markets seem to be missing the mark on Wall Street, as the Dow posted a strong positive candle along with another intraday and closing all-time high yesterday. The uptrend which is now six weeks long is intact at 27,528 today whilst momentum remains strongly configured. Just because the RSI is over 70, it should not necessarily mean a reversal is due, however, the run higher looks a little mature on Stochastics (flat) whilst MACD lines are also threatening to plateau. We remain positive on the Dow but still cautious as to how long this run will go without a correction being seen. The breakout support 27,308/27,399 is key, with initial support at 27,518.
"""DISCLAIMER: This report does not constitute personal investment advice, nor does it take into account the individual financial circumstances or objectives of the clients who receive it. All information and research produced by Hantec Markets is intended to be general in nature; it does not constitute a recommendation or offer for the purchase or sale of any financial instrument, nor should it be construed as such.
All of the views or suggestions within this report are those solely and exclusively of the author, and accurately reflect his personal views about any and all of the subject instruments and are presented to the best of the author’s knowledge. Any person relying on this report to undertake trading does so entirely at his/her own risk and Hantec Markets does not accept any liability. """
