After witnessing a rally of 31% since the low in August 2019 to the high in October 2019 price has merely become exhausted which has seen it suffer a huge decline.
What does this mean for price?
Is this the end of the palladium rally or will palladium continue to triumph?
Newbie traders viewing this decline would likely be running for cover especially if they have seen the 2-day 122 point drop on a lower timeframe. This move will appear much larger on the lower timeframe such as the 5-minute timeframe.
For this reason, we always want to view charts on the monthly, weekly and daily timeframes to get the bigger picture.
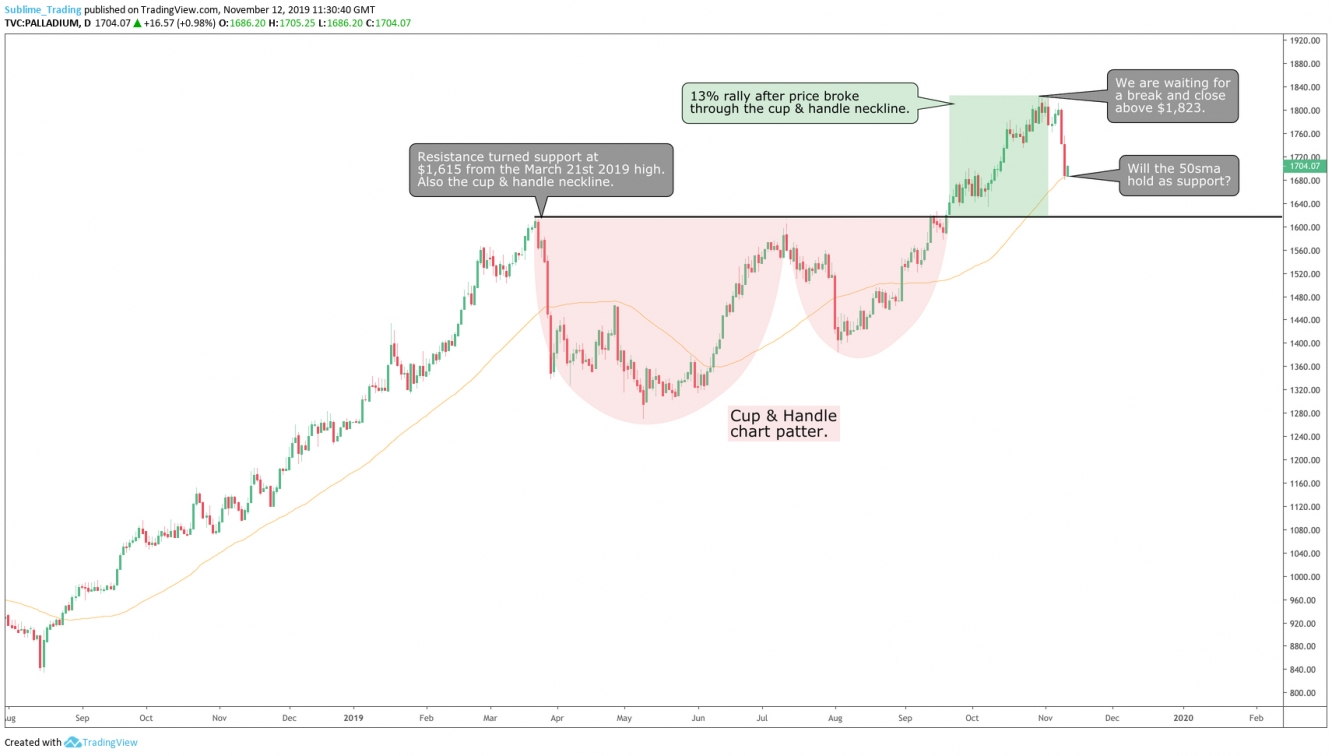
What we can clearly see from the daily chart below is a cup and handle pattern which lasted from March 21st 2019 to September 19th 2019.

A cup and handle in an uptrend is a strong trend continuation pattern. The pattern was only confirmed once price broke and closed above the neckline and since then we have seen a 13% move to the upside.
The rally has been interrupted with a sharp reversal for 2 consecutive days, dropping 122 points in that period and finding support at the 50sma. If this support does not hold price up then we have the major support from the cup and handle neckline at $1,615 to cushion the fall.
As the overall trend is bullish, the odds for a continuation to the upside is more likely. We still need to wait for confirmation of this, as price can sometimes surprise us and behave completely differently.
Waiting for a break and close above the current high at $1,823 will confirm further bullish moves and then we can compound on our current positions.
See more articles here.
Keep it simple, keep it Sublime!
