- 'Buffet Indicator' most overbought in history
- Citi says 10% decline in market possible
- Yields trim yearly highs
- Today the Federal Open Market Committee minutes from the January meeting are published.
- On Thursday crude oil inventories and initial jobless claims are released.
- Earnings roll on with results expected from Walmart (NYSE:WMT) on Thursday, Deere (NYSE:DE) on Friday and Nestle (OTC:NSRGY) on Feb. 25.
- Futures on the S&P 500 Index dropped 0.1%.
- The FTSE 100 Index fell 0.2%.
- The STOXX 600 Index sank 0.5%.
- The MSCI Asia Pacific Index climbed 0.1%.
- The MSCI Emerging Markets Index gained 0.4%.
- The Dollar Index advanced 0.3% to 90.78.
- The British pound dipped 0.1% to $1.3889.
- The euro decreased 0.2% to $1.2081.
- The onshore yuan weakened 0.4% to 6.458 per dollar.
- The Japanese yen strengthened 0.1% to 105.97 per dollar.
- Britain’s 10-year yield declined one basis point to 0.614%.
- The yield on 10-year Treasuries declined two basis points to 1.30%.
- The yield on two-year Treasuries declined less than one basis point to 0.12%.
- Germany’s 10-year yield increased less than one basis point to -0.34%.
- Japan’s 10-year yield climbed one basis point to 0.099%.
- West Texas Intermediate crude increased 0.5% to $60.38 a barrel.
- Brent crude gained 0.7% to $63.81 a barrel.
- Gold weakened 0.5% to $1,784.91 an ounce.
Key Events
The reflation trade continued to take a breather in trading on Wednesday, with yields retreating from yearly highs and small cap futures underperforming contracts on the Dow, S&P and NASDAQ. Global stock markets were also trading in negative territory.
Bitcoin hit a high of $51,647, reaching another milestone, while gold was weaker.
Global Financial Affairs
US futures fluctuated around yesterday’s close, but Russell 2000 contracts were 0.4% deep in the red in pre-US open trading on Wednesday. US domestic shares had been leading the broader market amid the cyclical rotation.
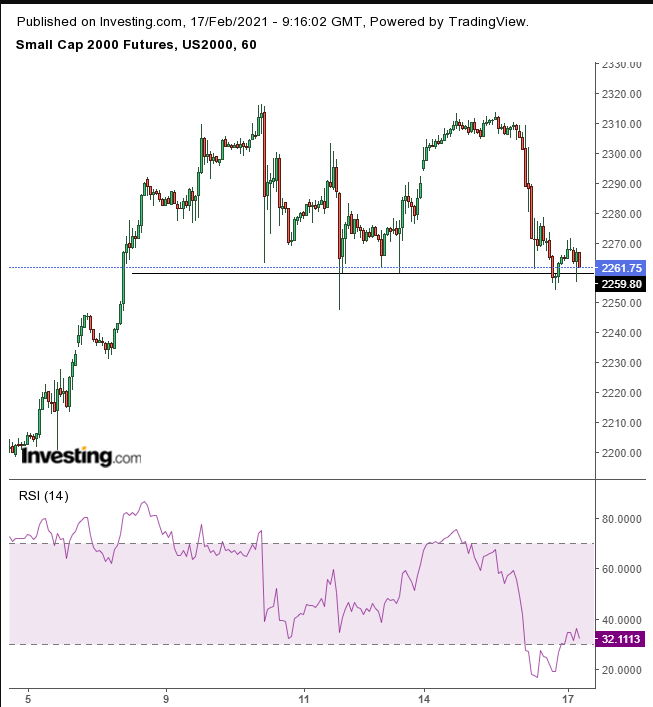
However, Russell futures were struggling with the potential double-top on the hourly chart, but the RSI’s bottoming out at the 16, extreme-oversold level since December suggests a rebound.
In the same vein, yields on the 10-year Treasury note, which have been rising on the expectations that higher interest rates would follow rising inflation, fell off their session highs, but were still at yearly highs.
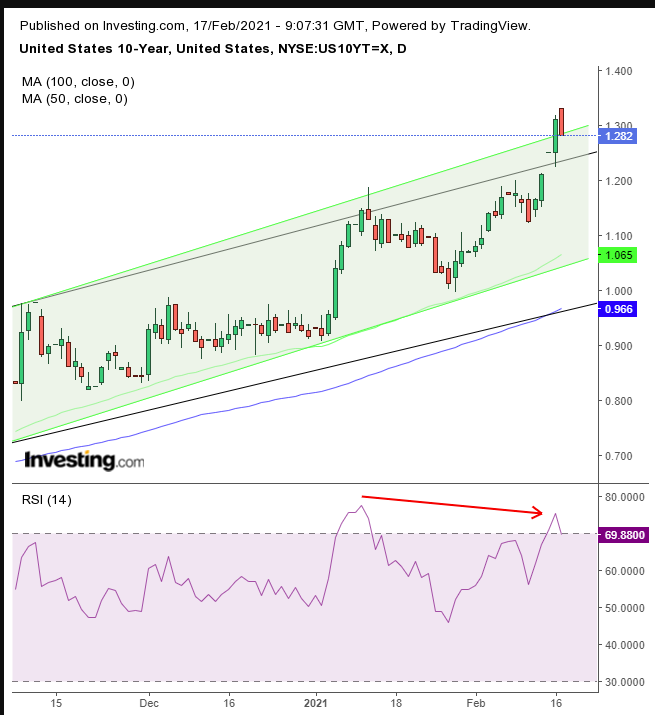
Rates stepped away from the day’s highs, but seemed to find support at the top of a rising channel, from which they escaped yesterday with an upside breakout, even after the rising channel already increased its steepness, as denoted by the green lines.
While the 50 DMA seamlessly supports and is camouflaged by the bottom of the green rising channel, and the 100 DMA just crossed above the bottom of the channel’s lower path of ascent, the RSI peaked at 75, below the 77+ level achieved with the price’s preceding, lower high, on Jan. 12.
Is this a minor breather in the reflation trade? More institutions are sounding alarms that the market is overheated and due a significant correction and some are even suggesting an outright crash.
A Citi strategist said that that a 10% slump in US stocks is 'very plausible.' Another sign worth heading: legendary investor and CEO of Berkshire Hathaway (NYSE:BRKa) (NYSE:BRKb), Warren Buffet’s favorite indicator, the market cap of the entire US stock market as a percentage of US GDP, is at 195%. This is much higher than it was before the dotcom crash and is signaling that stocks could tumble.
In Europe, the STOXX 600 Index extended a selloff to its second session, dragged down by retailers, offsetting positive corporate reports.
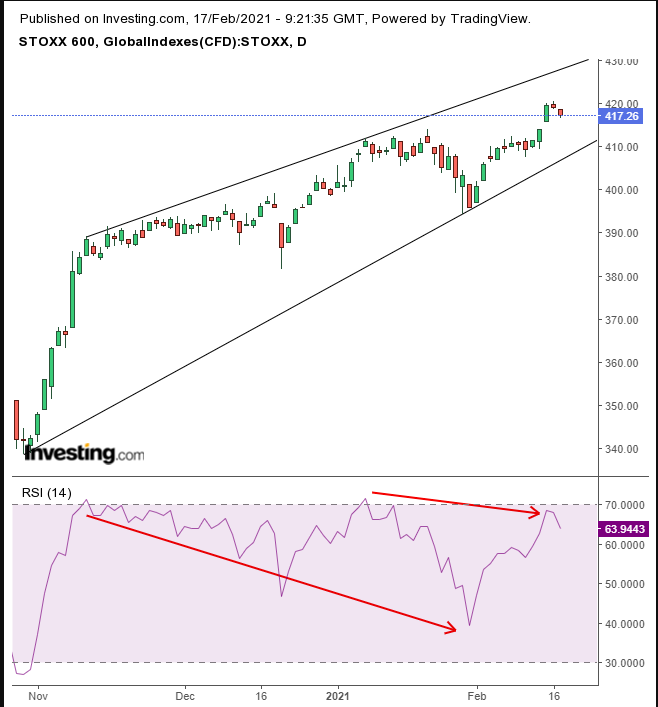
The pan-European benchmark may be developing a rising wedge, which could be bearish following a climactic advance, as investors sucked, in by fabulous returns, lose patience and selloff. The RSI’s negative divergence is showing that momentum is slowing down.
Dutch paint and coatings manufacturer, Akzo Nobel (AS:AKZO) shares jumped after the company beat earnings estimates due to a strong recovery in demand; further boosting the stock—it announced a 1 billion-euro share buyback and increased its dividend.
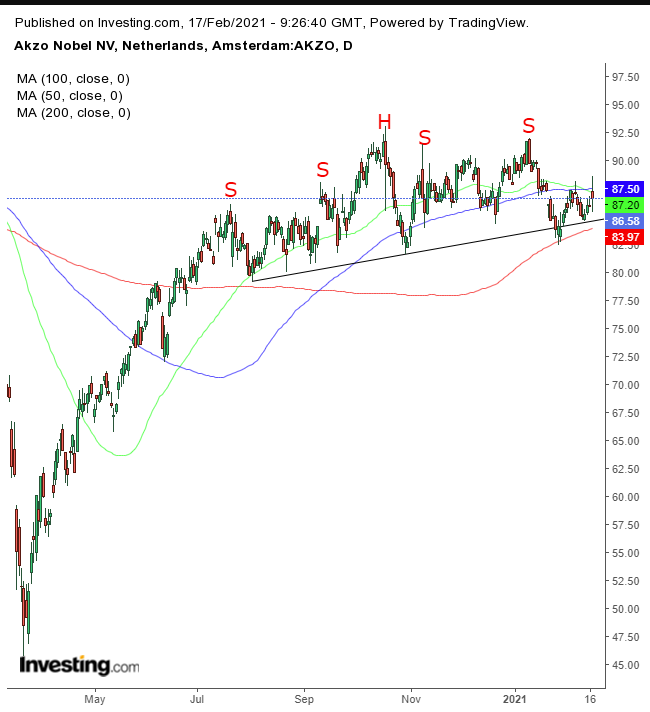
The price, however, is developing a H&S top, as the 50 DMA crossed below the 100 DMA, heading to the neckline and the 200 DMA, threatening a Death Cross.
Minings and metals behemoth, Rio Tinto (LON:RIO) also posted a 20% surge in annual profit, mirroring the jump in iron ore prices amid the reflation trade.
The dollar gapped higher but got stuck at the neckline of its H&S bottom, after an alternative interpretation of that trendline provided the price support.
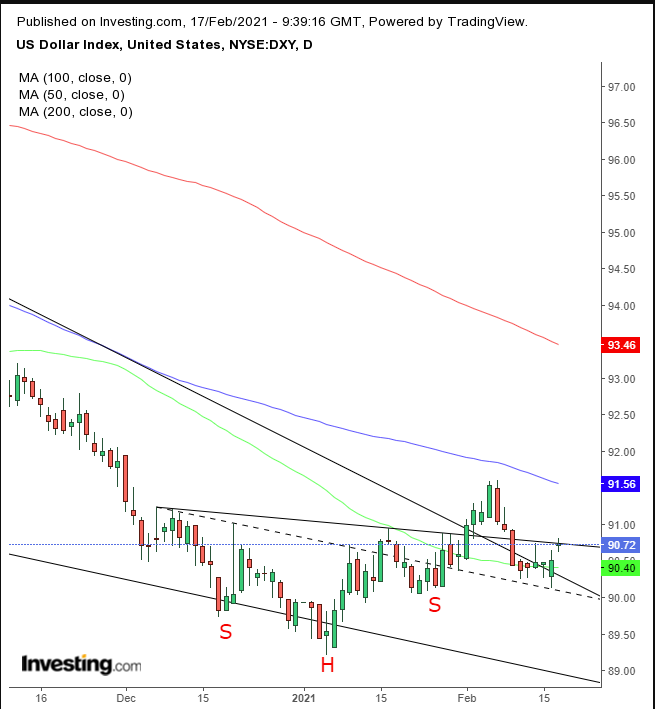
The price is currently back above the falling wedge since the March high.
Gold dropped on dollar strength.
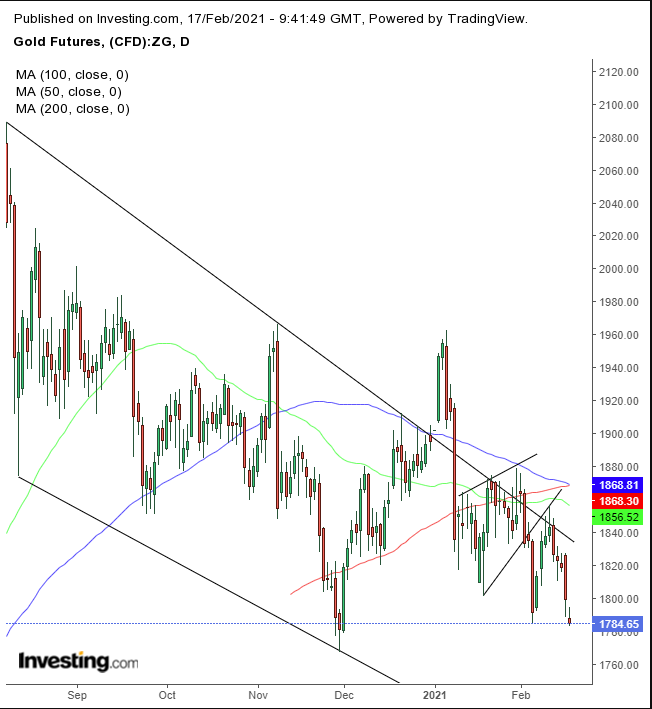
The yellow metal fell to its lowest since Nov. 30, signaling the return move to the rising flag is over and the falling channel is about to resume. Its slump saw the moving averages triggering a death cross.
Along with yields paring their highs, equity falls and the rise in the dollar, Bitcoin ascended above $51,000 for the first time. We advise caution.
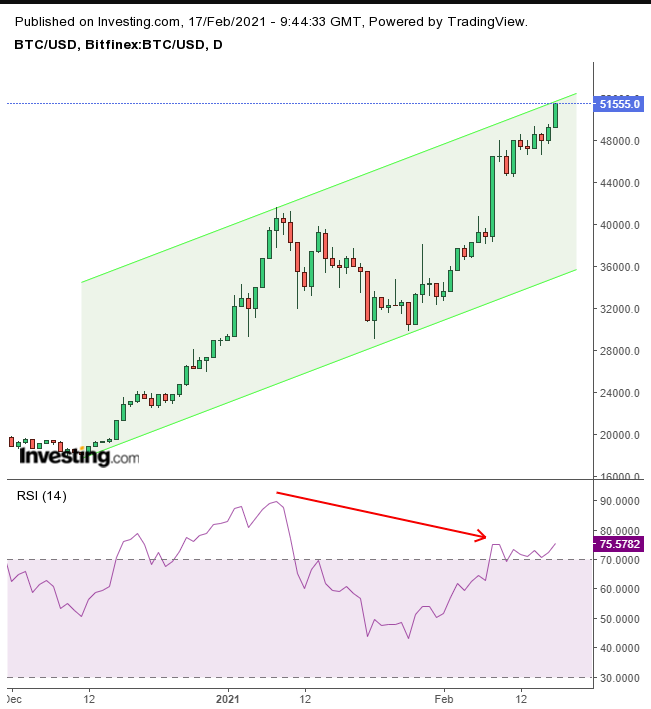
The RSI provided a negative divergence, as momentum fell against rising prices.
WTI climbed back above $60 as the energy crisis in parts of the US worsened. Natural gas, however, declined.
