Market Overview
It is a fairly muted start to what could be a busy week for traders. It is interesting to see that despite a very mild pick up in the Chinese PMIs, traders seem reluctant to take much of a view this morning. Perhaps it is a case of keeping powder dry ahead of some major data points, but also as the trade dispute could see a quiet few days ahead. Tuesday marks the beginning of a week of public holidays in China to celebrate the country’s 70th anniversary of the People’s Republic of China.
Although there has been chatter (albeit denied so far) about the US cranking up the pressure in the dispute by de-listing Chinese companies from Wall Street markets. Headlines of further moves are likely to be muted in the coming days. President Trump has already delayed the imposition of tariffs on China so as not to coincide with the celebrations, so it is unlikely that much would be done to flame tensions in the coming days. Away from the trade dispute, from tomorrow, there will be some tier one data points to drive sentiment, with PMIs in focus and US payrolls at the end of the week. So for now, there is a mixed look to markets. Although Treasury yields have ticked mildly higher, this tends to have been dollar negative recently, and there is a hint of this again today. However, there is also a continuation of the negative pressure on gold. Furthermore, equities are lacking direction into the European session. The only real mover this morning comes with weakness in the New Zealand dollar which is under pressure from a weakening business outlook.
Wall Street closed lower on Friday with the S&P 500 -0.5% at 2962 but with a rebound this morning by +0.3% this has left a rather mixed look to Asian markets. The Nikkei closed -0.6% whilst the Shanghai Composite was -0.4%. In European there is a very muted open with almost no direction on FTSE Futures or DAX Futures.
In forex, there is a hint of USD slipping back across major pairs, but there is also an underperformance of both NZD and AUD.
In commodities, gold is around -0.5% back (-$6) whilst moves on silver continue to be amplified, as oil is again on a negative drift.
There is a UK focus on the economic calendar to start the week. The final reading of UK Q2 GDP is at 09:30BST and is expected to show no change on the second reading at -0.2% for the quarter and the year on year data at +1.2%. The UK Current Account for Q2 is also at 09:30 BST and is expected to show an improvement I the deficit to -£19.5bn (from -£30.0bn in Q1) which would be the lowest deficit since Q1 2018.
Chart of the Day – EUR/GBP
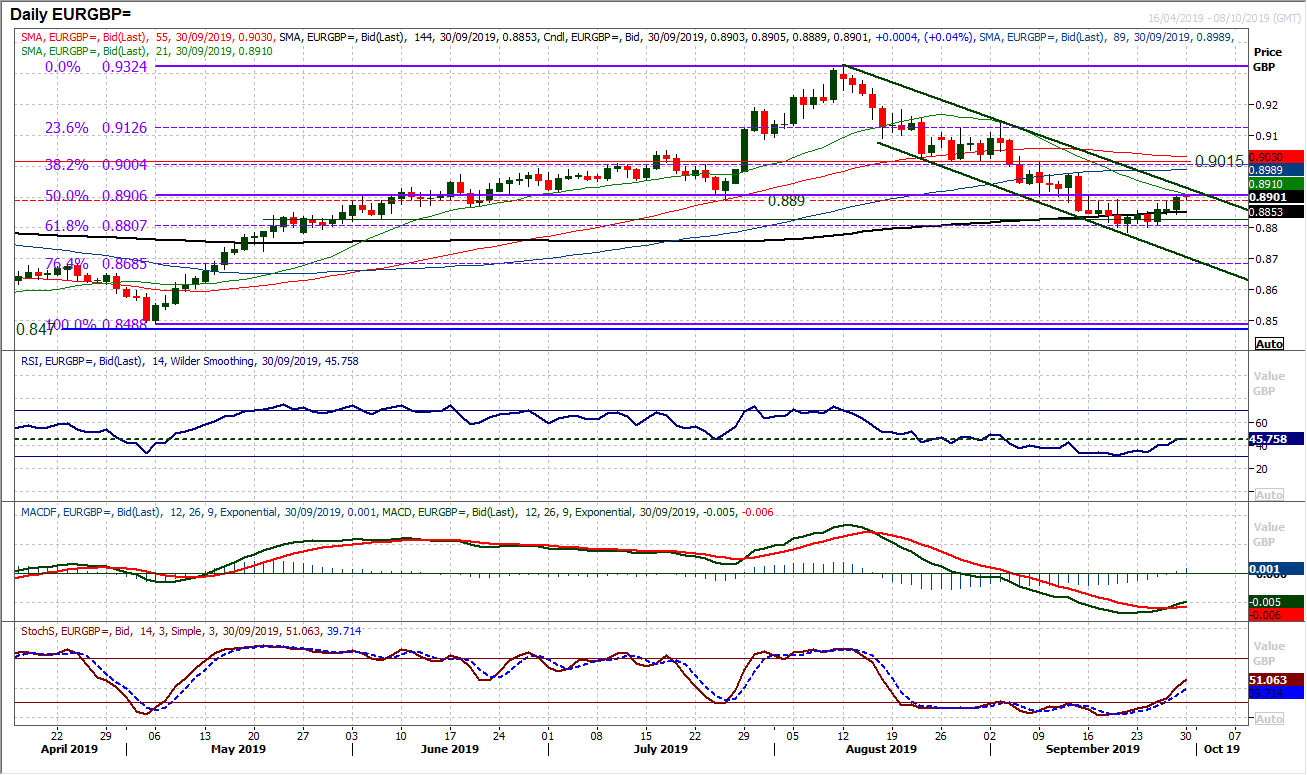
Euro/Sterling is at another interesting crossroads. The relative performance of both currencies measured through major crosses and given the rebound of EUR/GBP in recent sessions, it is sterling as the key underperformer. But is this a turnaround that has got legs? The old pivot at £0.8890 is being tested and given the proximity to the 50% Fibonacci retracement of the £0.8488/£0.9324 rally (at £0.8906) this is a key moment. This is because the sell-off found support around the 38.2% Fib level at £0.8807 and a move above the 50% Fib would imply a breakout to the 61./8% Fib at £0.9004. The momentum indicators are leading the market into potential recovery now. A bull cross has confirmed on Stochastics (having been bearishly configured for five weeks) and now this is joined by a MACD bull cross. There needs to be a move clear of £0.8906 as during previous consolidations of the past six weeks, there have been false breakouts. The RSI moving above 50 would confirm recovery momentum. With a closing breakout above £0.8906 it would open £0.8975/£0.9015 as the next band of resistance. The hourly chart shows the importance of a pivot at £0.8845 now which is growing and supportive.
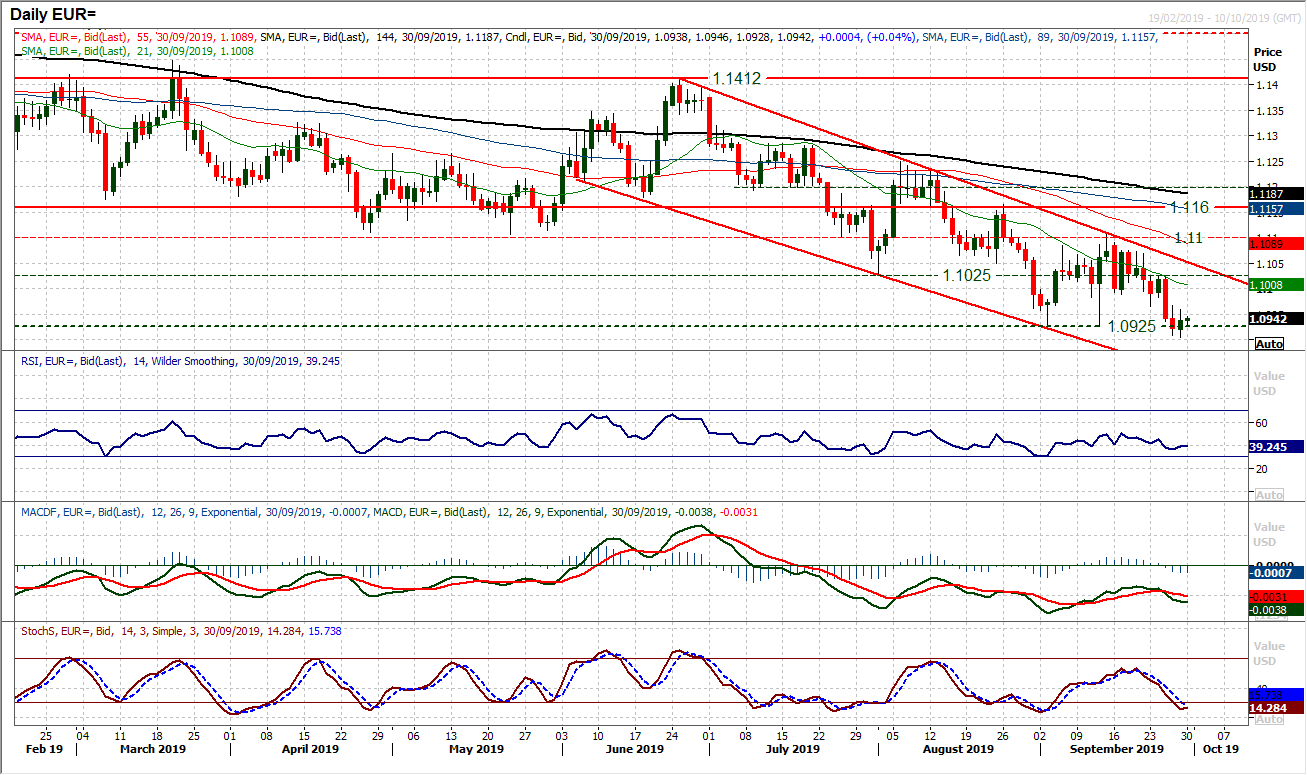
A positive candle saw the bulls end last week on a positive note. However, the outlook remains under pressure. There is an ongoing downtrend channel which is adding continued pressure on the bulls. Rallies are faltering at old broken support levels, whilst moving averages all fall in negative sequence The latest breakdown below $1.0925 has picked up from $1.0903 but rallies need to continue to be treated as another chance to sell. The positive candle leaves a mild calming of the negative configuration on momentum, however, there is little real prospect of a sustainable rebound. The hourly chart shows resistance at $1.0965/$1.0990 is a near term sell zone, with more considerable resistance at $1.1025. Expect rallies to fade and further pressure on the $1.0900 area before the next support around $1.0850.
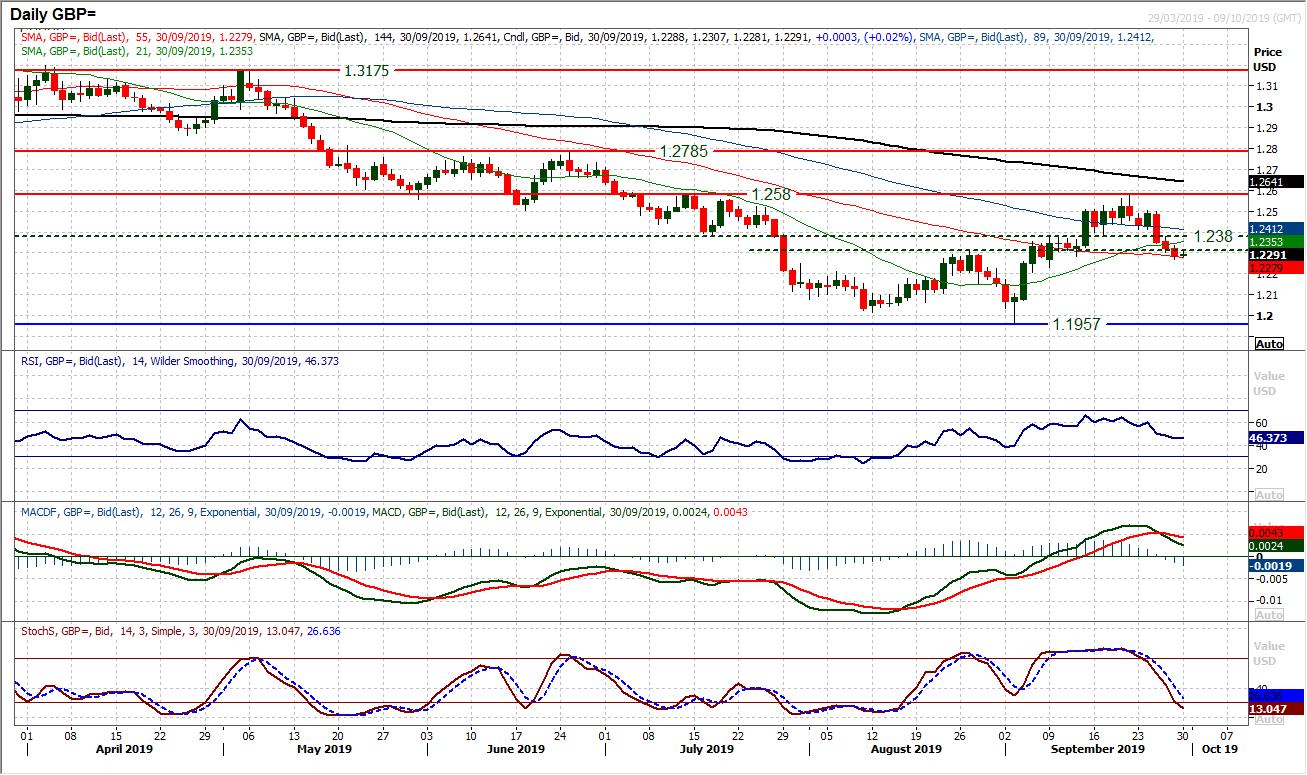
With sterling performance moving into reverse, there have now been five of the past six daily candlesticks being negatively configured. The sellers are taking control. This comes as Cable has closed now below the old neckline of the base at $1.2305. Momentum has turned negative, with MACD lines bear crossing, RSI falling below 50 and Stochastics pushing into bearish configuration. The hourly chart reflects this with a run of lower highs and lower lows, whilst importantly, the old pivot at $1.2380 has become a basis of resistance now. The market has had several looks at $1.2280 now and this is a level that is hanging on by a thread, something that needs to continue, in order to prevent a decisive corrective outlook forming. A close below $1.2280 is below all moving averages and opens $1.2230 initially but given the significance of the corrective momentum, this is a move that would open deeper downside.
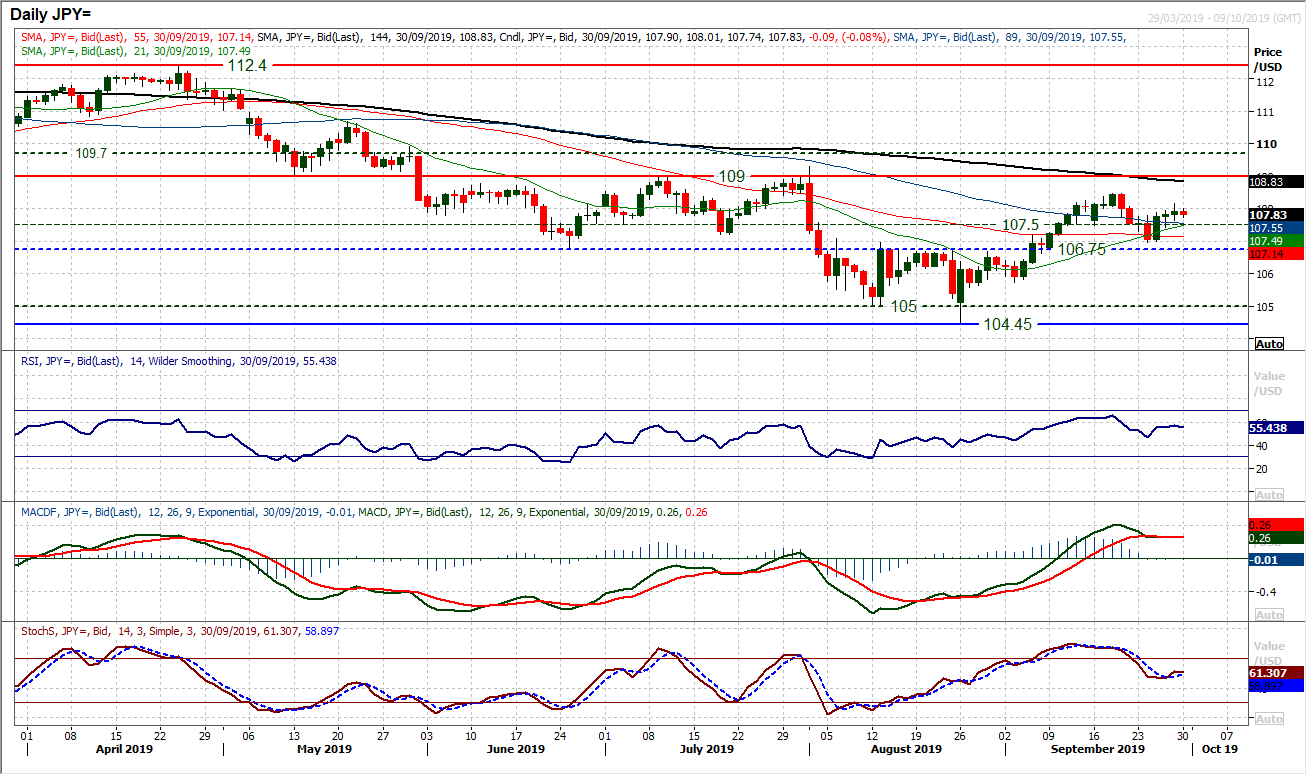
The dollar bulls have been edging higher with a lack of real conviction in recent sessions. Subsequently, Dollar/Yen is still somewhat mixed in outlook. A look above 108.00 could not be sustained on Friday and the market has just begun to slip slightly lower this morning. This comes with an ongoing indecisive look to momentum, whereby RSI is hovering a shade above 50, MACD lines flat in mild positive territory and Stochastics are flat a shade above neutral. This reflects the mild positive configuration but a market that needs much more to convince. Even this morning, the market has slipped back into the support band 107.40/107.75 and hourly momentum has just lost some impetus, threatening a more neutral configuration again. Support at 106.95 is key, whilst Friday’s high at 108.15 is growing resistance.
Gold
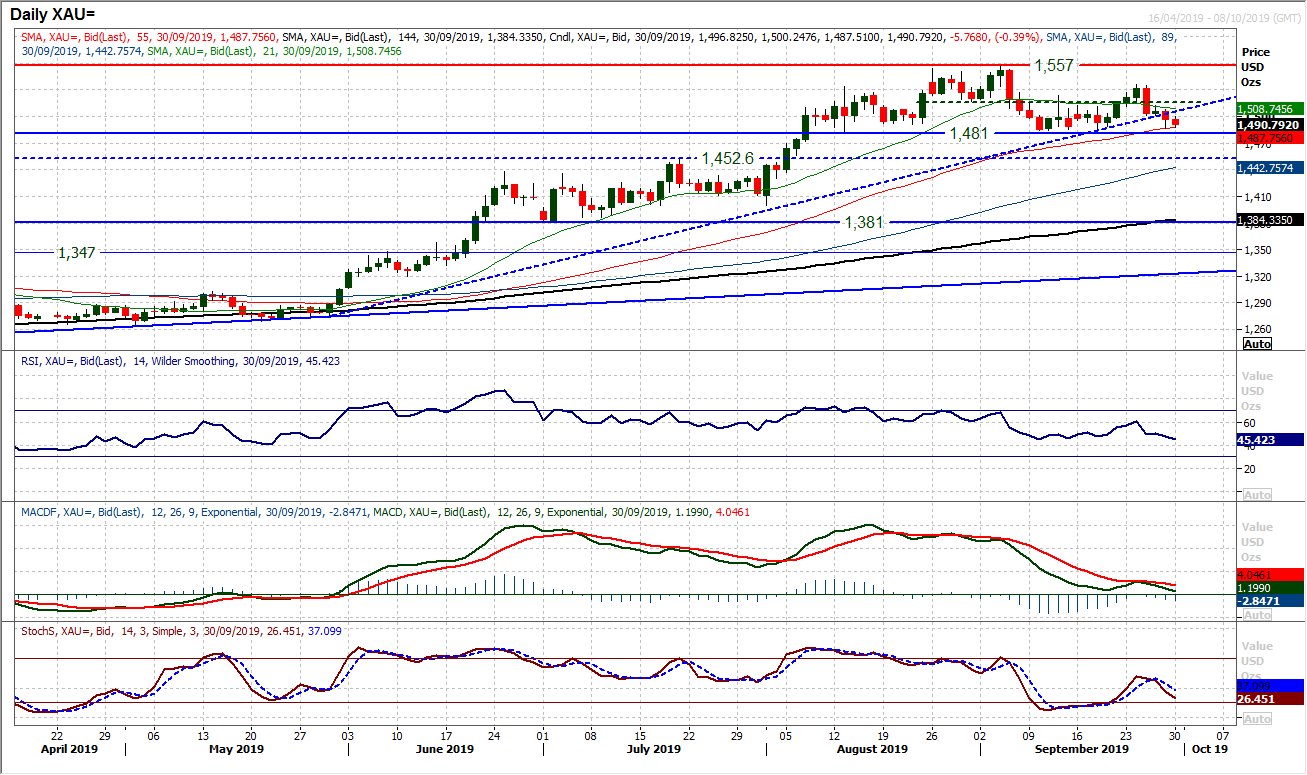
The bulls are under growing threat now. A decisive negative candlestick to break the four month uptrend leaves gold close to the bottom of the seven week trading range. The fear is that this trading range being broken would complete a top pattern which would completely change the configuration of the outlook. Momentum indicators have been deteriorating in the past month, but having turned lower around neutral levels (RSI under back 50, MACD lines “bear kiss” just above neutral, Stochastics crossing lower around 50) reflects a near tem negative outlook. A close below the $1481/$1484 support band completes a head and shoulders top which would imply a -$75 downside target. Subsequent support comes in at $1453. The momentum on hourly chart is increasingly negatively configured (RSI failing under 50, MACD lines under neutral) and intraday rallies are failing at lower levels. The hourly chart shows resistance at $1502 and then $1511.
WTI Oil
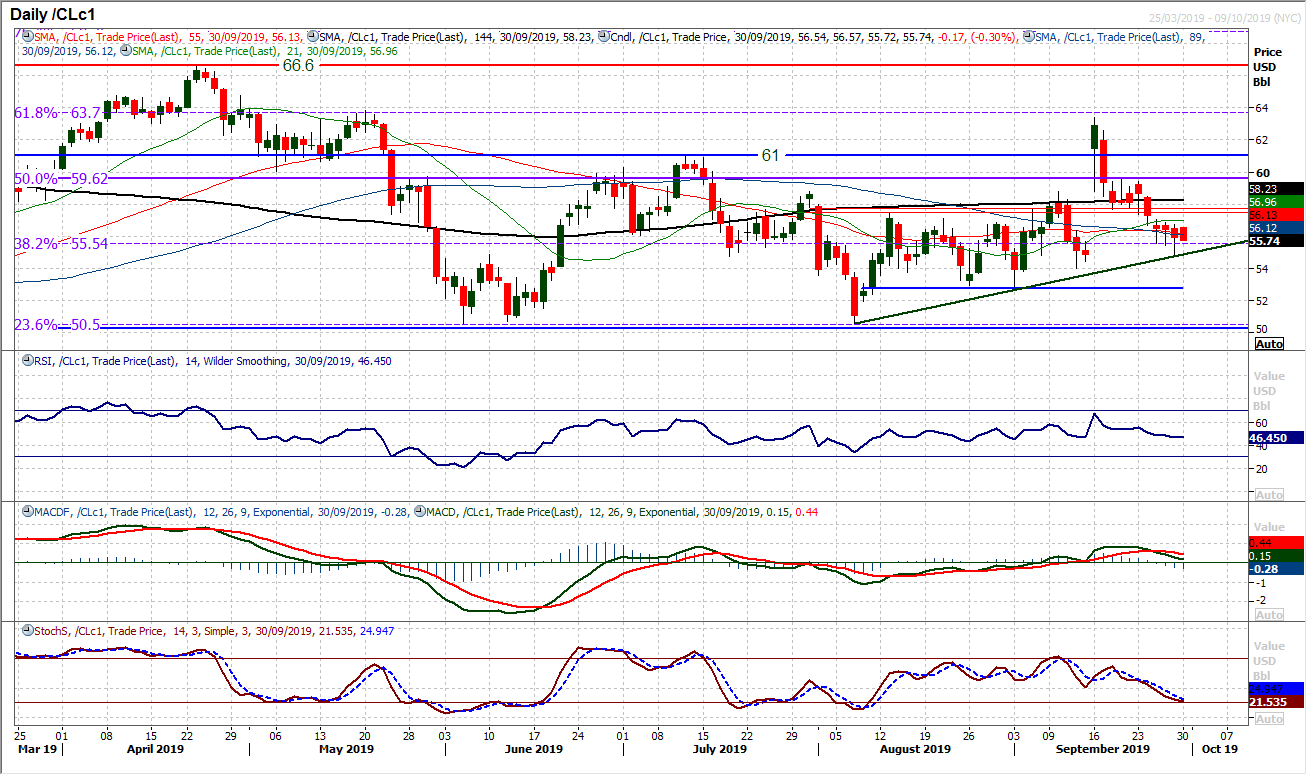
The candlestick analysis on WTI is incredible, in that there are now 13 of the past 14 candles with a negative configuration. It continues to suggest the bulls are struggling for any foothold in the market. Intraday rallies are continually being sold into. The market has though had a look at the $55.55 support of the 38.2% Fibonacci retracement in each of the past three sessions and has subsequently closed back above. The negative drift on Stochastics reflects the run of bear candles, whilst MACD lines have crossed lower. There is an ongoing negative bias to moves that suggest rallies will continue to struggle though. Initial resistance at $56.85/$57.00, whilst any rally faltering under $57.50/$57.75 is a chance to sell. Below $55.55 opens support around $53.00/$54.00.
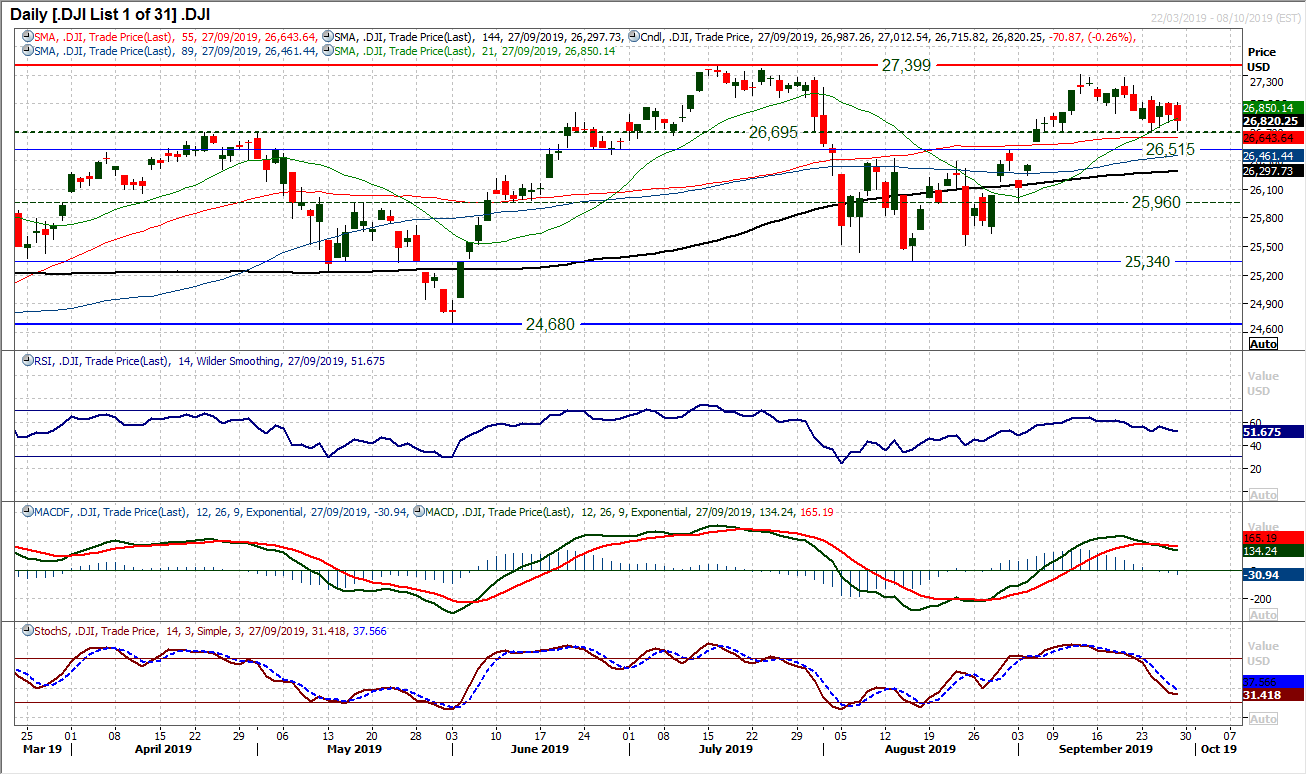
Although the market closed lower on Friday, there is still a sense of consolidation about Wall Street for the time being. The market spent the week stuck in a 270 tick range (basically 1%) and we know little more now than we did a week ago. Focus has been on the old breakout and pivot levels which are supportive between 26,515/26,695 and once more on Friday this was effectively the basis of support. A consolidation is in progress still, but in aggregate, there is a mild negative bias to candlestick configuration which is acting as a mild drag on momentum still. This is reflected on the hourly chart too. However, whilst the support band 26,515/26,95 remains intact there is little real drive to the move. A catalyst is needed and the bulls will be looking for a close above resistance at 27,080 to generate a spark once more. We remain buyers into weakness.
"""DISCLAIMER: This report does not constitute personal investment advice, nor does it take into account the individual financial circumstances or objectives of the clients who receive it. All information and research produced by Hantec Markets is intended to be general in nature; it does not constitute a recommendation or offer for the purchase or sale of any financial instrument, nor should it be construed as such.
All of the views or suggestions within this report are those solely and exclusively of the author, and accurately reflect his personal views about any and all of the subject instruments and are presented to the best of the author’s knowledge. Any person relying on this report to undertake trading does so entirely at his/her own risk and Hantec Markets does not accept any liability. """
