'Value' and 'growth' are two investment approaches that many stock market investors subscribe to. The choice of investing style is an important decision, likely to affect total long-term returns. Most financial planners concur that when used together, the two styles could help retail investors diversify their portfolios and achieve robust long-run results.
Companies that follow a growth strategy are expected to expand their earnings at faster rates than that of their peers or the broader market. As a result, investors are not shy about bidding up their share prices. Thus, they usually have high valuation multiples.
On the other hand, value stocks are typically underpriced and oversold, i.e., "unloved," usually due to negative news and sentiment. Their fundamental metrics are usually “cheap” in terms of measures like earnings per share, book value per share, price-to-sales or cash flow per share.
Warren Buffett has long been recognized as one of the most successful value investors of all time. The long-term performance of his holding company, Berkshire Hathaway (NYSE:BRKa) (NYSE:BRKb), is a testament to the strength of his value investing principles.
Today, we introduce two exchange-traded funds that might appeal to readers seeking businesses trading at discounts to their intrinsic values.
1. iShares S&P Small-Cap 600 Value ETF
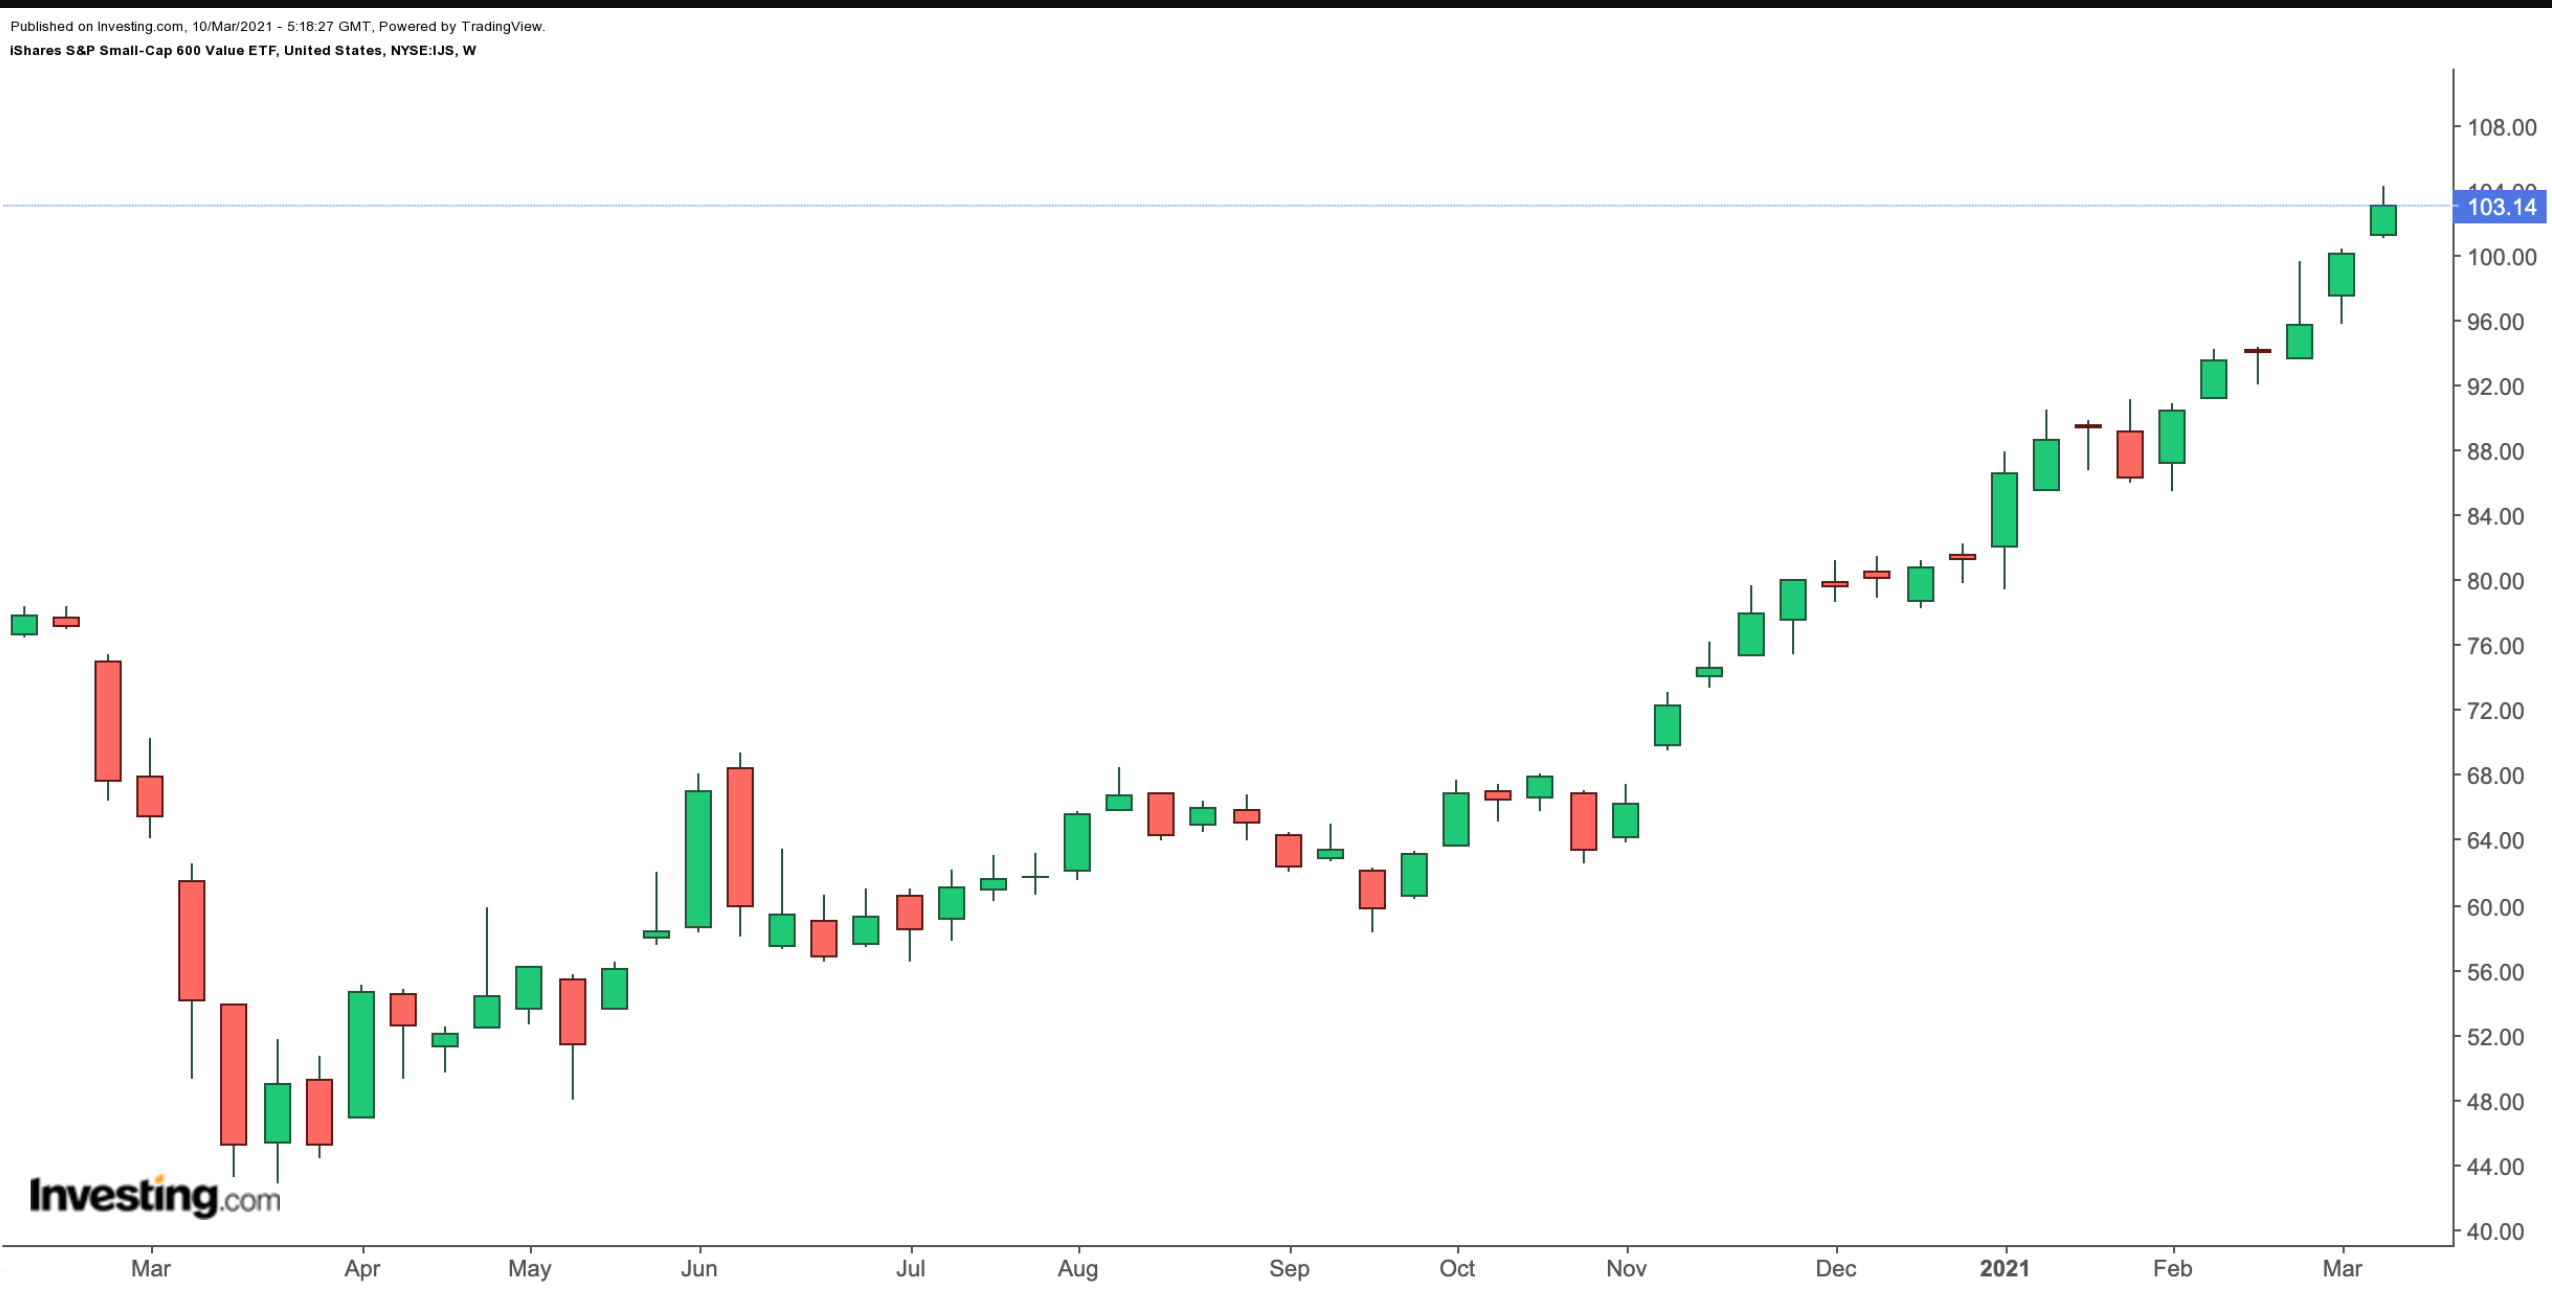
Current Price: $103.14
52-Week Range: $42.81 - $104.32
Dividend Yield: 1.58%
Expense Ratio: 0.18%
The iShares S&P Small-Cap 600 Value ETF (NYSE:IJS) invests in US small-capitalization stocks that are regarded as undervalued by the market relative to their peers. We previously discussed small-cap growth stocks. Today, our focus is on value in the small-cap space.

IJS, which has 541 holdings, tracks the returns of the S&P Smallcap 600 Value Index. Since its inception in July 2000, net assets have grown to $8.7 billion.
In terms of sectoral allocation, financials have the highest weighting (24.60%), followed by industrials (17.80%), consumer discretionary (14.81%), real estate (9.56%) and information technology (8.01%). The top 10 names comprise less than 10% of the fund. In other words, no company can affect the fund significantly by itself.
The BCF Treasury Fund (XTSLA), which invests in US Treasury bills, notes and other direct obligations of the US Treasury, makes up 1.66% of assets. Next in line are the retailer Macy’s (NYSE:M); provider of residential security and fire products Resideo Technologies (NYSE:REZI); GameStop (NYSE:GME), which has been in the limelight since the start of the year; BankUnited (NYSE:BKU); and Pacific Premier Bancorp (NASDAQ:PPBI) are among the other leading names in the roster.
In recent months, broader indices, like the Dow Jones Industrial Average, the S&P 500 Index, and the NASDAQ 100 Index, have soared to what might be considered overvalued levels. As a result, many analysts have been discussing the importance of including small-caps as well as value shares in portfolios.
Readers might be interested to know that IJS has returned more than 27% year-to-date (YTD). In the past 12 months, it is up over 58%. In fact, the fund has recently hit a record high.
The fund’s trailing P/E and P/B ratios stand at 18.94 and 1.63, respectively. Given the recent run-up in price, short-term profit-taking in many names that make up the fund could be likely. A potential decline toward the $95 level would offer better value.
2. Invesco S&P 500® Pure Value ETF
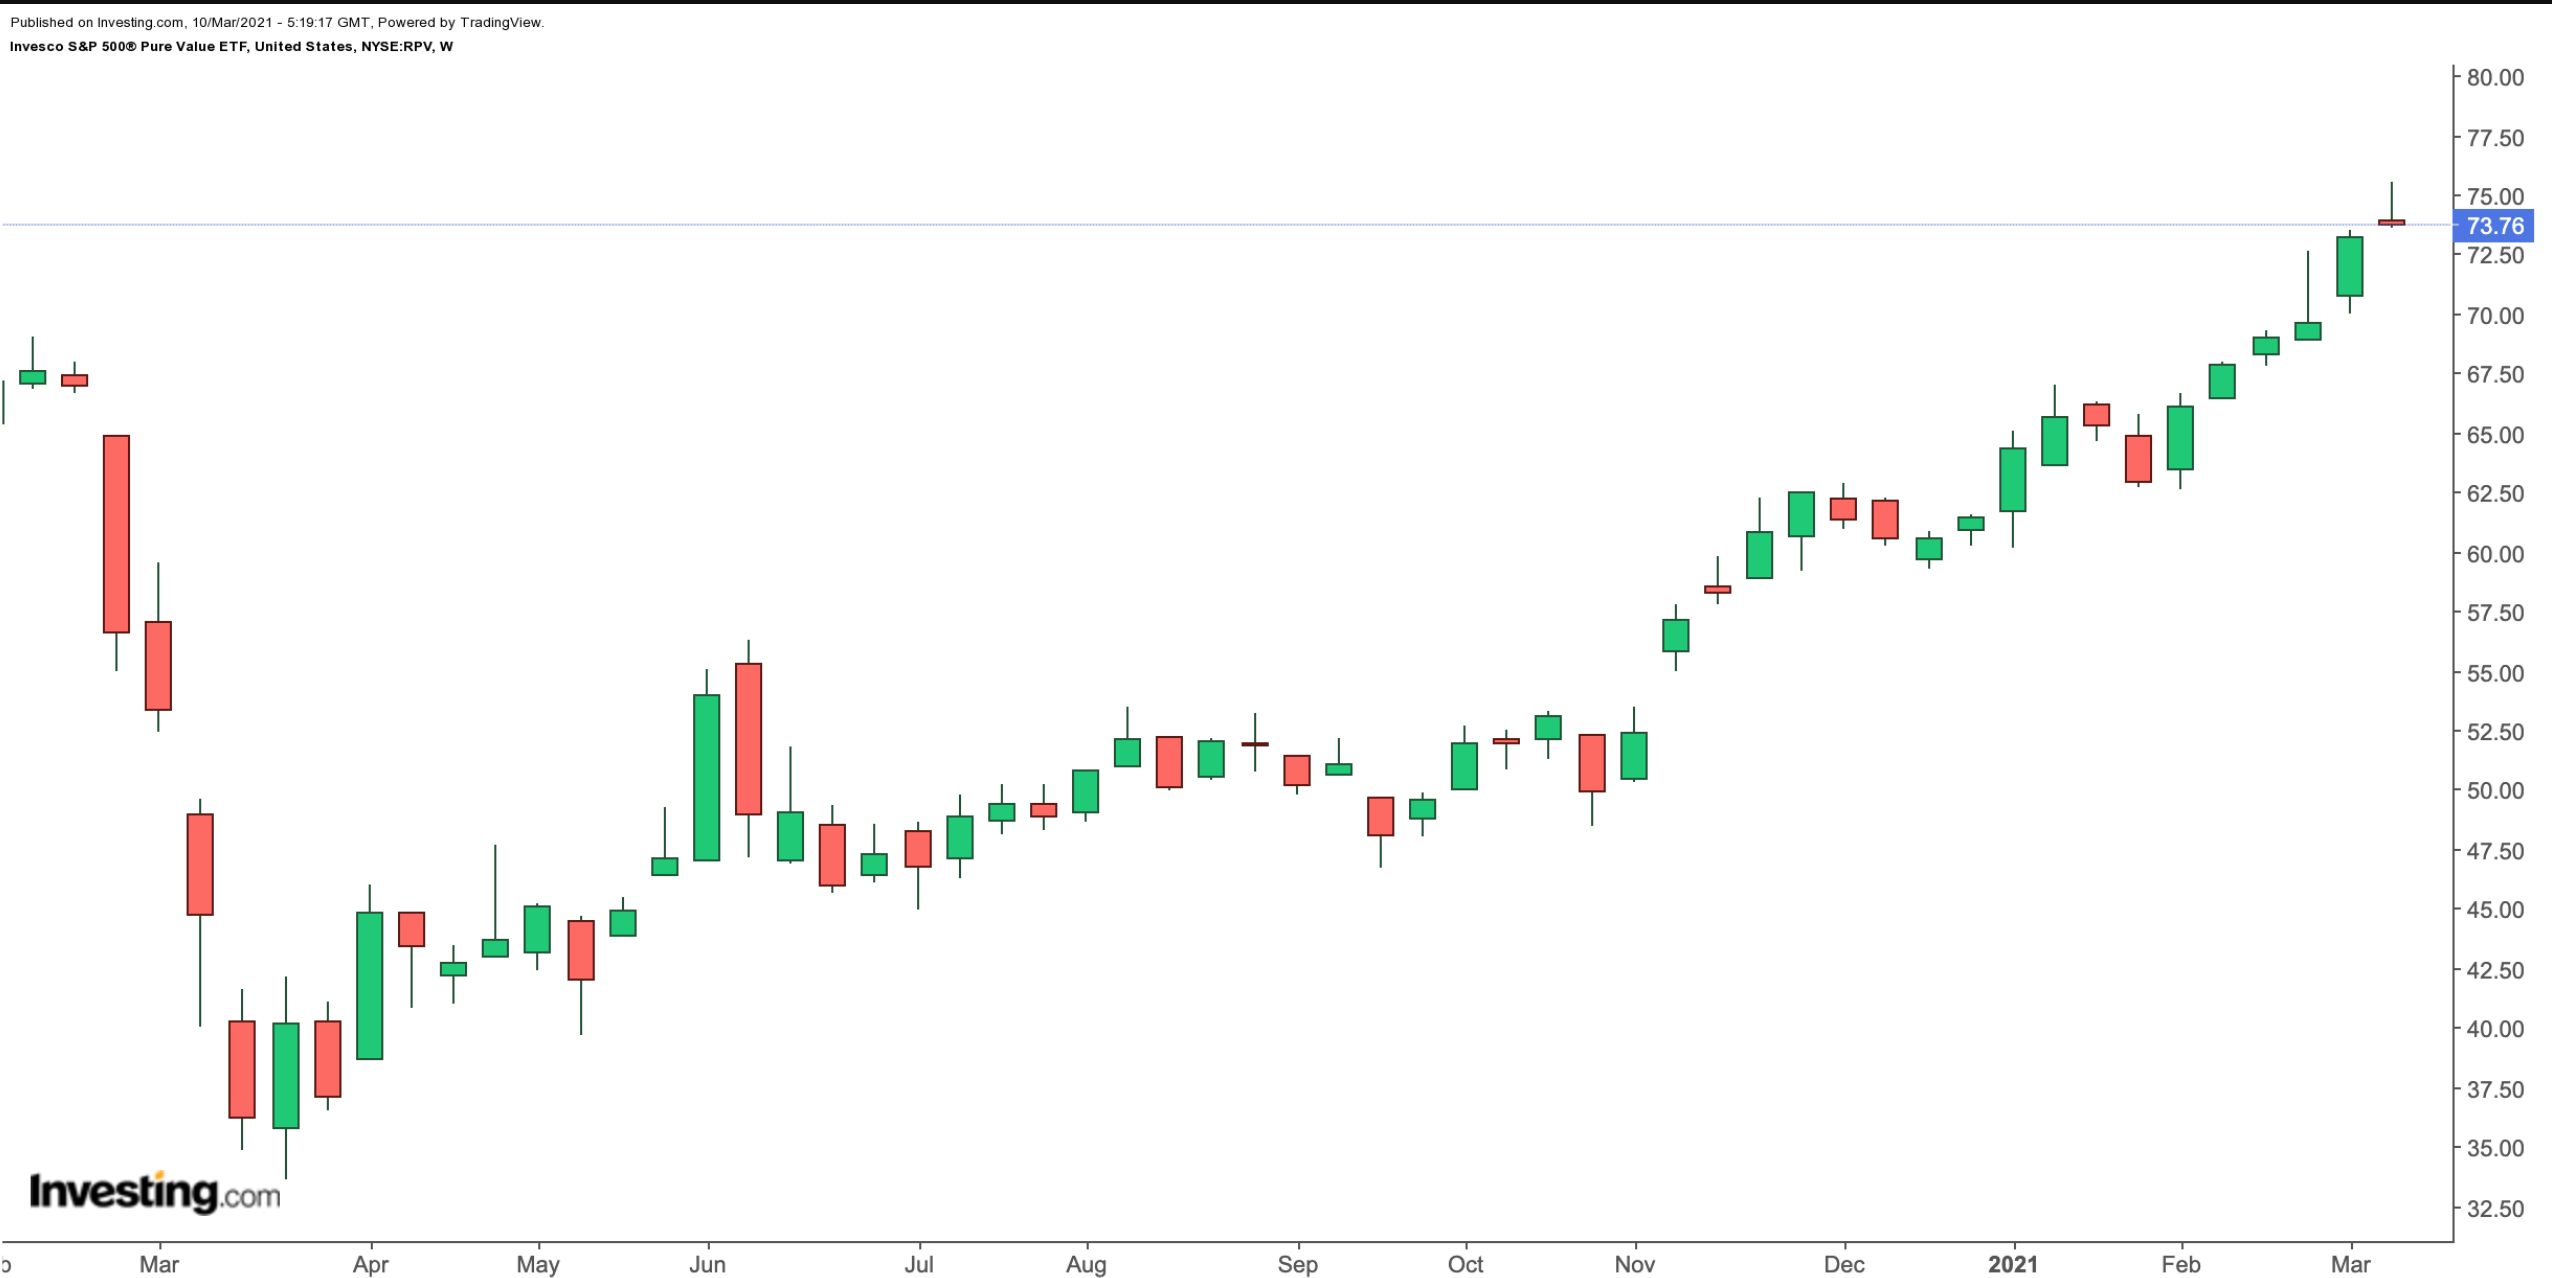
Current Price: $73.76
52-Week Range: $33.62 - $75.53
Dividend Yield: 1.73%
Expense Ratio: 0.35%
Our second fund for today is the Invesco S&P 500® Pure Value ETF (NYSE:RPV). It gives access to companies from the S&P 500 Index that exhibit value characteristics. The three metrics used are: book-value-to-price ratio, earnings-to-price ratio and sales-to-price ratio.

RPV, which tracks the returns of the S&P 500 Pure Value Index, has 124 holdings. Both the index and the fund are rebalanced annually. Since its inception in March 2006, assets have reached $1.7 billion.
In terms of sectors represented, financials have the highest weighting (41.33%), followed by energy (9.99%), consumer discretionary (8.95%), health care (8.73%) and consumer staples (7.59%).
Around 20% of the fund is held in the leading 10 stocks. Unum Group (NYSE:UNM), which provides comprehensive financial insurance products; petroleum refiners HollyFrontier (NYSE:HFC) and Valero Energy (NYSE:VLO); Berkshire Hathaway; and telecommunications group Lumen Technologies (NYSE:LUMN) head the names in the fund.
YTD, the fund is up about 21%, and hit an all-time high in March. Forward P/E and P/B ratios stand at 11.69 and 0.86, respectively. We believe the fund should be on investors' radar.
