
Looking back at equity factors in Q1 2024 with WisdomTree
2024 started on a strong note, with global equity markets gaining 8.9%[1]. The initial focus was on Artificial Intelligence, its growth potential and its impact on corporate profitability. However, with better-than-expected economic data being published in the US, Europe and China, market confidence grew, leading to a regional broadening of the bull market. Europe closed 7.6%1 up, which is quite close to the 10.3%1 of the US. The only weakness remains in Asia, leading to emerging markets returning only 2.4%1.
This instalment of the WisdomTree quarterly equity factor review aims to shed some light on how equity factors behaved during this first quarter and how this may have impacted investors’ portfolios.
- Overall Quality and Growth continued to do well in developed markets. However, Momentum took the lead, returning double-digit outperformance in the US and globally
- Small Cap suffered from the postponement of rate cuts and, after a strong Q4, they posted the deepest underperformance in Q1
- High Dividend, Value and Min Volatility continued to suffer
- In emerging markets, Momentum was also strong, but Growth led the way, with Tech stocks and new economy companies benefiting the most from the better-than-expected economic news.
Performance in focus: Continued bull run for Q1
In Q1, the MSCI World (+8.9%) and the MSCI USA (+10.3%) continued to perform very strongly. The impact of the AI megatrends continued to be felt, with Nvidia (NASDAQ:NVDA) gaining 82.5% during the quarter, for example, but the big news was on the economic front. The economy in the US remained very robust, leading to the postponement of rate cuts to later in the year. Economic data out of Europe and China, while not amazing, was better than expected, leading to good performance in those markets as well.
Overall, this led to some broadening of the market's breadth. Only four out of the Magnificent Seven beat the S&P 500 this quarter, for example, with only Nvidia and Meta posting significant outperformance. The impact on factors was also clear, with a difficult quarter when many factors underperformed, as well as some rotation.
- In global developed markets, Growth and Quality continued to outperform, with the exception of Europe, where Quality did not do as well
- Momentum was the strongest factor this quarter. It outperformed in all regions, posting double-digit outperformance in the US and globally
- Small Caps’ fortune changed radically from being the best factor in Q4 to being the worst one in Q1
- Overall in developed markets, High Dividend, Min Volatility and Value suffered the bulk of the underperformance
- In emerging markets, Momentum was also strong, but Growth led the way, with Tech stocks and new economy companies benefiting the most from the better-than-expected economic news

Market breadth is improving: A positive sign for the current bull market
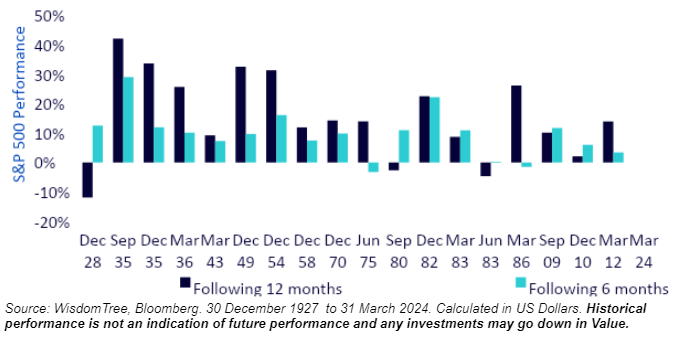
In Q1, US equities returned their second consecutive double-digit return. While this may seem like nothing in the context of the last 18-month rally it is, in fact, quite rare. This is only the 19th time since 1927 that this happened (i.e. 5% of the time). Interestingly enough, the performance in the following six months has been positive 16 times out of 18, and the performance in the following 12 months has been positive 15 times out of 18.
Investors have focused on the market's narrowness since early 2023 and the emergence of the “Magnificent Seven” narrative. As discussed earlier, Q1 showed a divergence in the performance of those seven mega caps, with Tesla and Apple (NASDAQ:AAPL) showing some weaknesses. To assess the evolution of the market's breadth this quarter, in Figure 3, we look at the Advance Decline Line for the S&P 500.
The Advance/Decline Line is a cumulative indicator. It is calculated by adding the difference between the number of advancing and declining stocks on a daily basis. So, the indicator goes up if more stocks advance rather than decline. It helps investors assess how wide the market is. In a rising market, if the indicator is going up, it means that the market is wide and that a majority of stocks are going up with the market. If the indicator is down, though, it indicates that only a minority of stocks are driving the market up, and that indicates narrowness and a potential weakness of the rally.
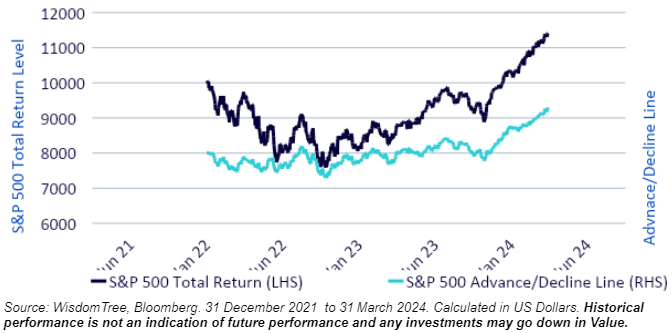
Figure 3 clearly shows that market breadth has been improving since late 2023 and that the current bull market is now quite well supported.
Valuations decreased in the US in Q1
In Q1 2024, developed markets became mostly more expensive. However, Small Caps and Growth Stocks became cheaper. The drivers for those moves varied, though. Small Caps’ valuations declined due to negative performance, while growth stocks' valuations declined due to increasing earnings.
Valuations in the US declined mostly except in Value and High Dividend. On the contrary, in Europe, valuations increased almost across the board.
Looking forward to Q2 2024
Economies have been showing great robustness, and while “higher for longer” will continue a bit longer than expected, rate cuts are coming. These easier monetary conditions, combined with improving economies and broadening markets, should continue to provide a tailwind to equity markets. However, with valuations at relatively high levels and the upcoming US presidential election, risks remain ever-present. A balanced approach to equity investment that combines upside participation and downside protection could remain a safe choice for investors.
World is proxied by MSCI World net TR Index. The US is proxied by MSCI USA net TR Index. Europe is proxied by MSCI Europe net TR Index. Emerging Markets is proxied by MSCI Emerging Markets net TR Index. Minimum volatility is proxied by the relevant MSCI Min Volatility net total return index. Quality is proxied by the relevant MSCI Quality net total return index.
Momentum is proxied by the relevant MSCI Momentum net total return index. High Dividend is proxied by the relevant MSCI High Dividend net total return index. Size is proxied by the relevant MSCI Small Cap net total return index. Value is proxied by the relevant MSCI Enhanced Value net total return index. WisdomTree Quality is proxied by the relevant WisdomTree Quality Dividend Growth Index.
[1] Source: WisdomTree, Bloomberg. 31 December 2023 to 31 March 2024. Historical performance is not an indication of future performance and any investments may go down in Value.
Disclaimer
This material is prepared by WisdomTree and its affiliates and is not intended to be relied upon as a forecast, research or investment advice, and is not a recommendation, offer or solicitation to buy or sell any securities or to adopt any investment strategy. The opinions expressed are as of the date of production and may change as subsequent conditions vary. The information and opinions contained in this material are derived from proprietary and non-proprietary sources. As such, no warranty of accuracy or reliability is given and no responsibility arising in any other way for errors and omissions (including responsibility to any person by reason of negligence) is accepted by WisdomTree, nor any affiliate, nor any of their officers, employees or agents. Reliance upon information in this material is at the sole discretion of the reader. Past performance is not a reliable indicator of future performance.