Market Overview
So apparently, according to the US Treasury, China is a “currency manipulator”. This comes as the yuan has weakened to record levels against the dollar, with USD/CNH rising decisively above 7.00 for the first time. Whether China is a “currency manipulator” is highly debatable (the PBoC has often previously acted to prevent weakening). However it was interesting to see the PBoC setting a stronger mid-point for the currency (around which the yuan has a 2% fluctuation), and importantly below 7.00. Could it be that this one act could shift market sentiment? It is too early to say, but we have subsequently seen markets turning a bit of a corner. Bond yields are back higher, with the 10 year yield 8 basis points off its intraday low. Gold has pulled back over a percent from its intraday high, whilst US equity futures have ticked higher. In forex, we see Dollar/Yen bouncing strongly and EUR/USD back from its own highs. The higher risk currencies are also finding support. The Reserve Bank of Australia held rates steady at +1.00% (no change expected at +1.00%) and this is helping the Aussie to outperform. This now brings several major markets back to some important levels where traders will be asking, is this just a dead cat bounce before the bear sentiment resumes? With markets nervous of this key 7.00 level, how the PBoC treats the currency fixing around the dollar could be key to any stabilisation, at least in the near term.
Wall Street closed enormously lower with the S&P 500 -3.0% at 2845, but US futures are bouncing back, around +0.3% higher today. In Asia, the selling pressure was relatively contained, with the Nikkei -0.6% and Shanghai Composite -1.3%. European markets are looking mixed but off their earlier lows. have some early weakness with the FTSE futures -0.3% but the DAX futures +0.3%. In forex, we see GBP finding a basis of support, whilst Dollar/Yen is showing a decent recovery too. AUD is the key outperformer in the wake of the RBA decision. In commodities we see gold having given back earlier gains and currently trades mildly lower, whilst oil has bounced 1%.
It is a fairly quiet day for the economic calendar today. The US JOLTS jobs openings for June are the only real announcement to be concerned with, at 1500BST and expected to drop very slightly to 7.317m (from 7.323m in May).
It will also be an idea to keep a look out for the comments of arch-dove of the FOMC speakers, James Bullard (voter, very dovish) who speaks at 1700BST. Bullard has previously dissented dovishly (in June) and will be expected to call for more rate cuts.
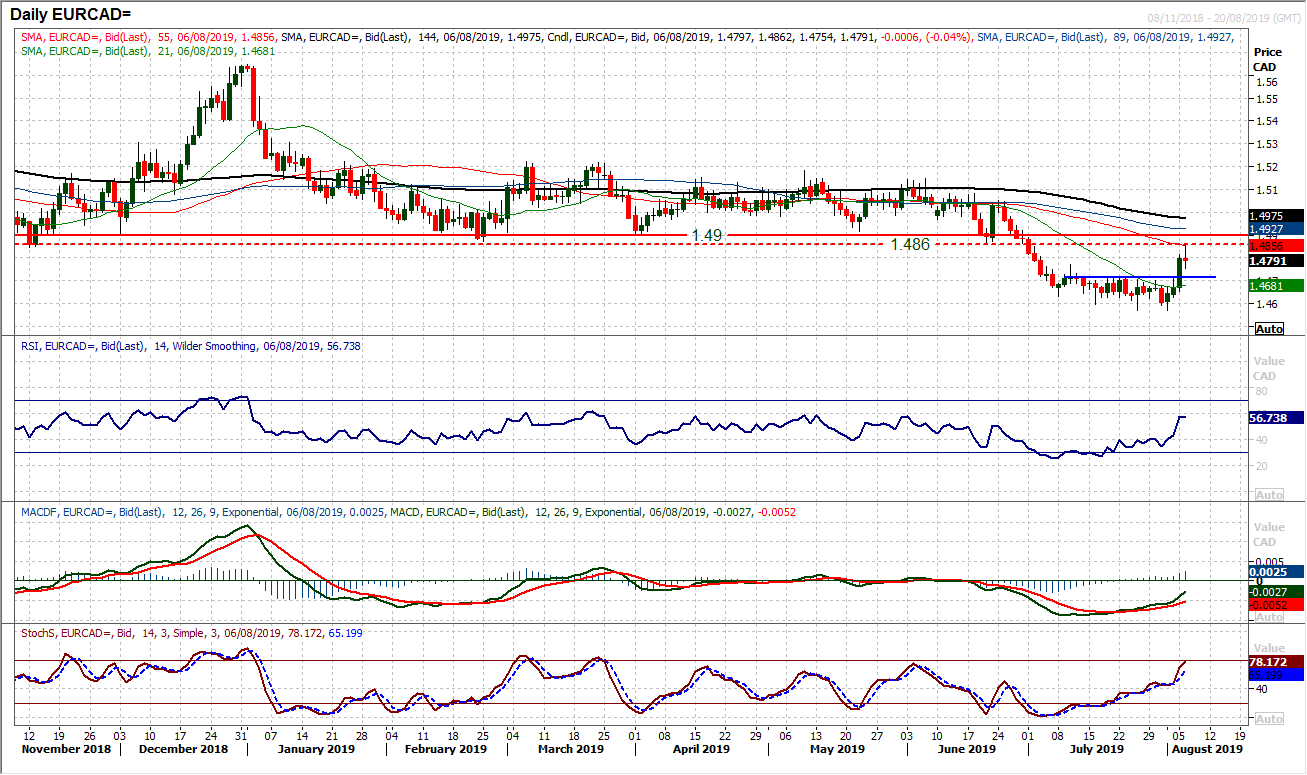
Chart of the Day – EUR/CAD
The euro has been performing well in recent days, almost taking on safe haven characteristics, meaning that the higher risk Canadian dollar has been suffering. This has now driven traction through Euro/Canadian with a recovery pattern. A breakout above resistance at 1.4715 take the cross to a three week high and effectively completed a small base pattern that implies 1.4860. However, interestingly, that implied target has already been hit early this morning. The recovery to the overhead supply of the old 1.4860/1.4900 floor. Momentum on the daily chart is still with the recovery, but given that the market has already given back around 80 pips, the risk is that the rebound has played out already. The hourly chart needs to be watched for negative momentum signals no. The hourly RSI under 50 would be a signal, with MACD and Stochastics slipping back too. Look for initial support at 1.4740 holding this morning, whilst the neckline breakout at 1.4715 also needs to hold as a basis of support now. In these fast moving markets, turning points can be quick and trade management is key.
EUR/USD
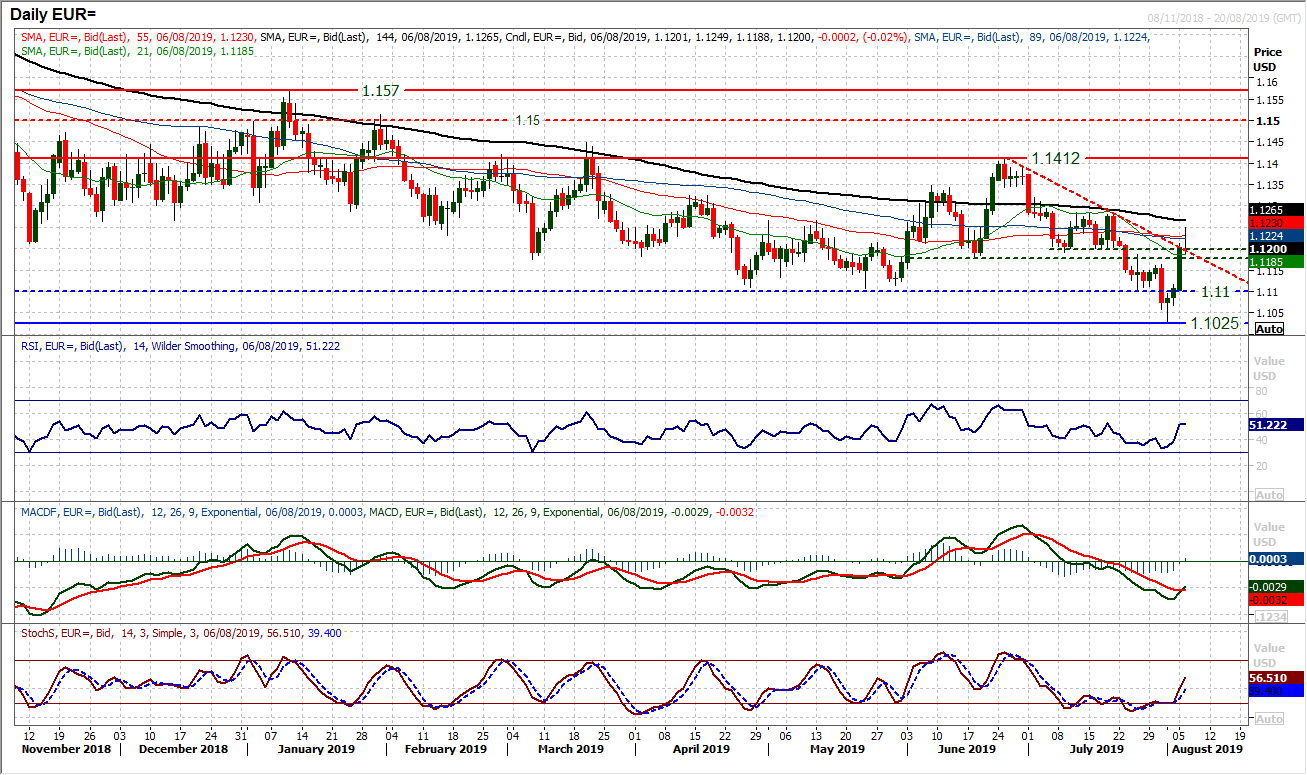
An incredible turnaround on ER/USD in the past few days has seen the market add over 200 pips in a recovery that has now broken the six week downtrend. However, is this a move that signals the beginning of euro outperformance? We do not believe so, but the market is now back around a crucial crossroads. The near term momentum has been impressive for the bulls, with the RSI back around 50, MACD lines crossing back higher and Stochastics also picking up. However, a pullback from $1.1250 is back around $1.1200 once more, an area which marks a pivot band $1.1180/$1.1200. This is a crucial moment for the bulls. Can they begin to use $1.1180/$1.1200 as support again? If so, then there is a chance for continued recovery. However, there is still a medium term corrective outlook to the pair and there have recently been failed attempts for the euro bulls to gain control. Once the dust settles on this rather turbulent moment for major currency markets, we expect to see the drift lower resume. A close back under $1.1180 would suggest this would be coming again.
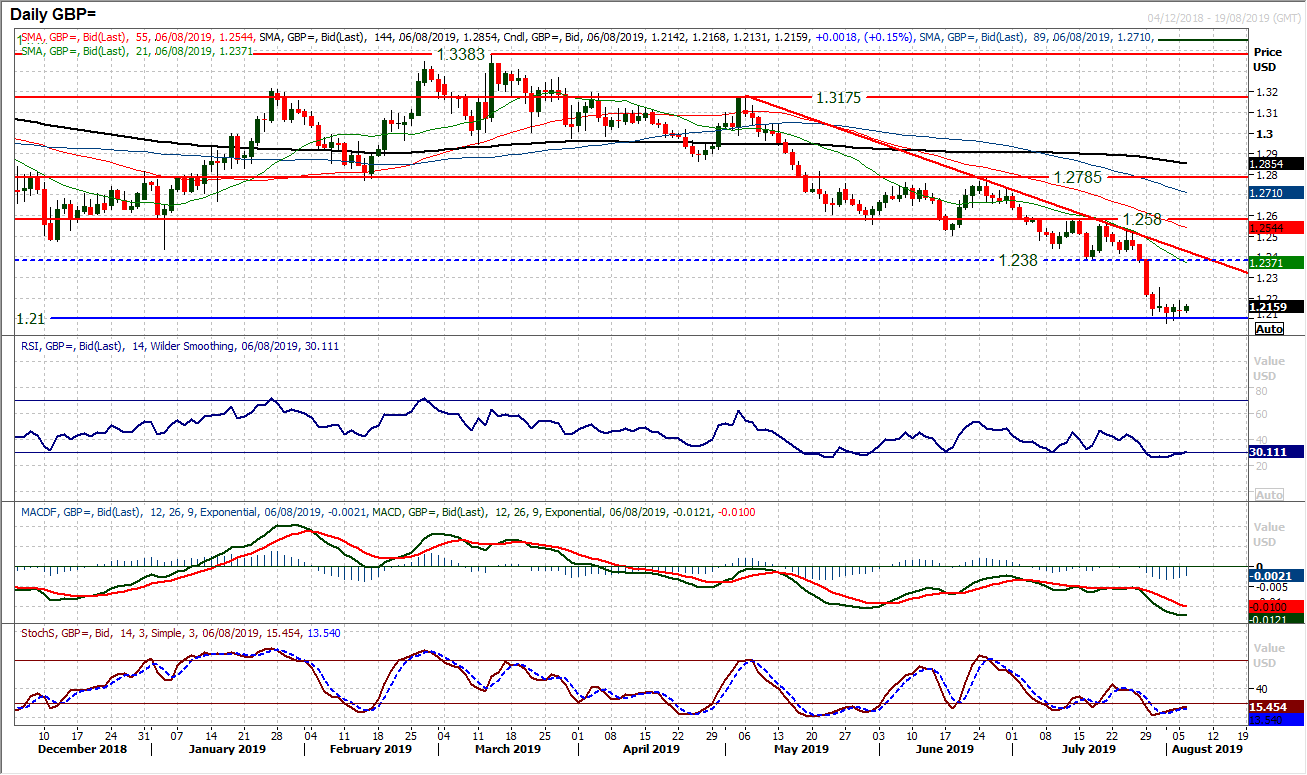
It might sound incredible to say, but with all the elevated daily swings on markets, Cable is the calm one of the major pairs right now. The past few sessions have seen very little direction as support around $1.2100 has held. Despite this, we remain sellers into strength on Cable. An early tick higher today helps to build on the support again and it appears that, for now, the selling pressure has dissipated. However, there are no decisive reversal signals on the daily chart. Momentum is mildly stretched and this is restricting the downside, but little else for the bulls to go on. The hourly chart is also suggesting it is a market bumping along the bottom, with little conviction for any recovery. Resistance initially at $1.2190 from yesterday’s high, before $1.2250, but any unwinding move that fails under $1.2380 is another chance to sell. Expect a retest of $1.2077 and likely to $1.1980 in due course.
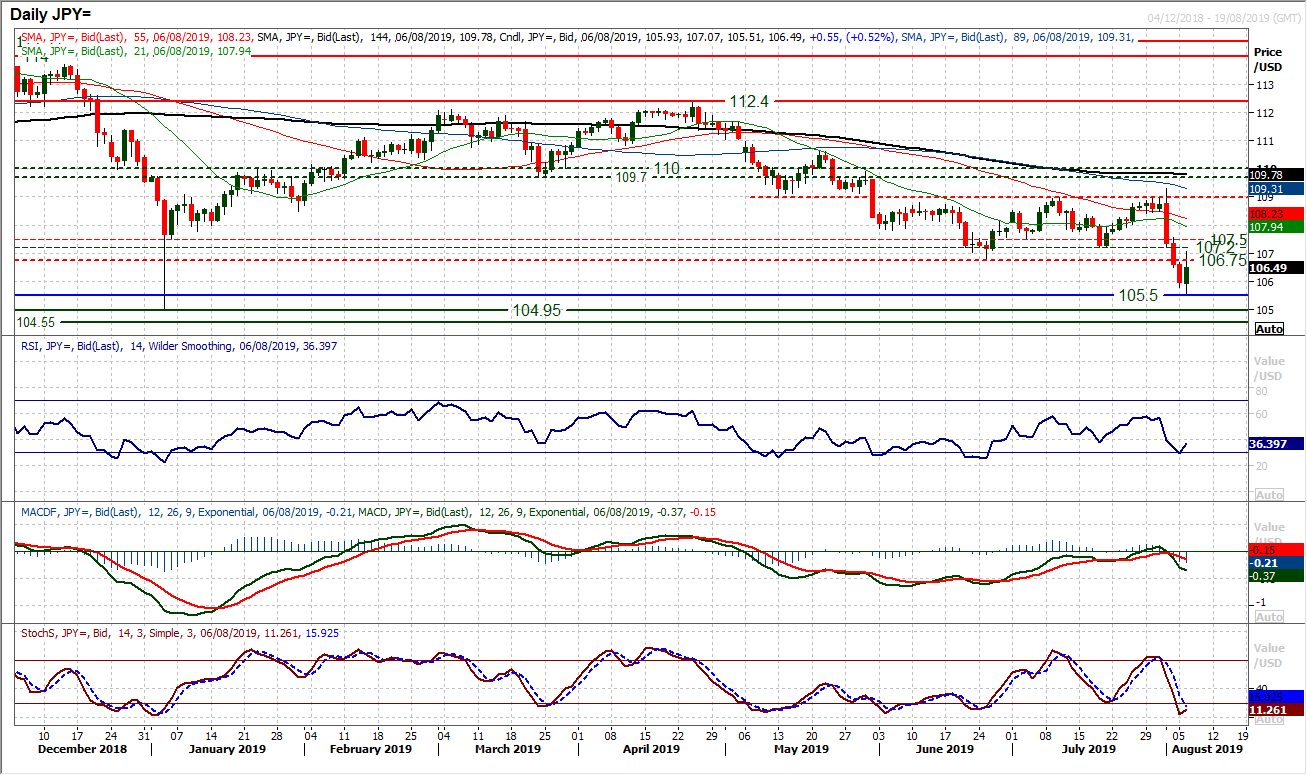
The move to oversold territory (especially on the hourly chart) has started to drive a technical rally overnight. Is Dollar/Yen about to decisively recover? There is a significant barrier of overhead supply between 106.75/107.50 which will be key to answering this. From this morning’s early low of 105.50, the market has bounced over 150 pips, so this is a very volatile market to be playing. Swings back higher on RSI and Stochastics are beginning to form on the daily chart. However, the hourly chart shows this move as unwinding a stretched market so far. Subsequently reaction to the resistance band is key. We remain sellers into strength in this market and 106.75/107.50 looks to be a prime area of opportunity now.
Gold
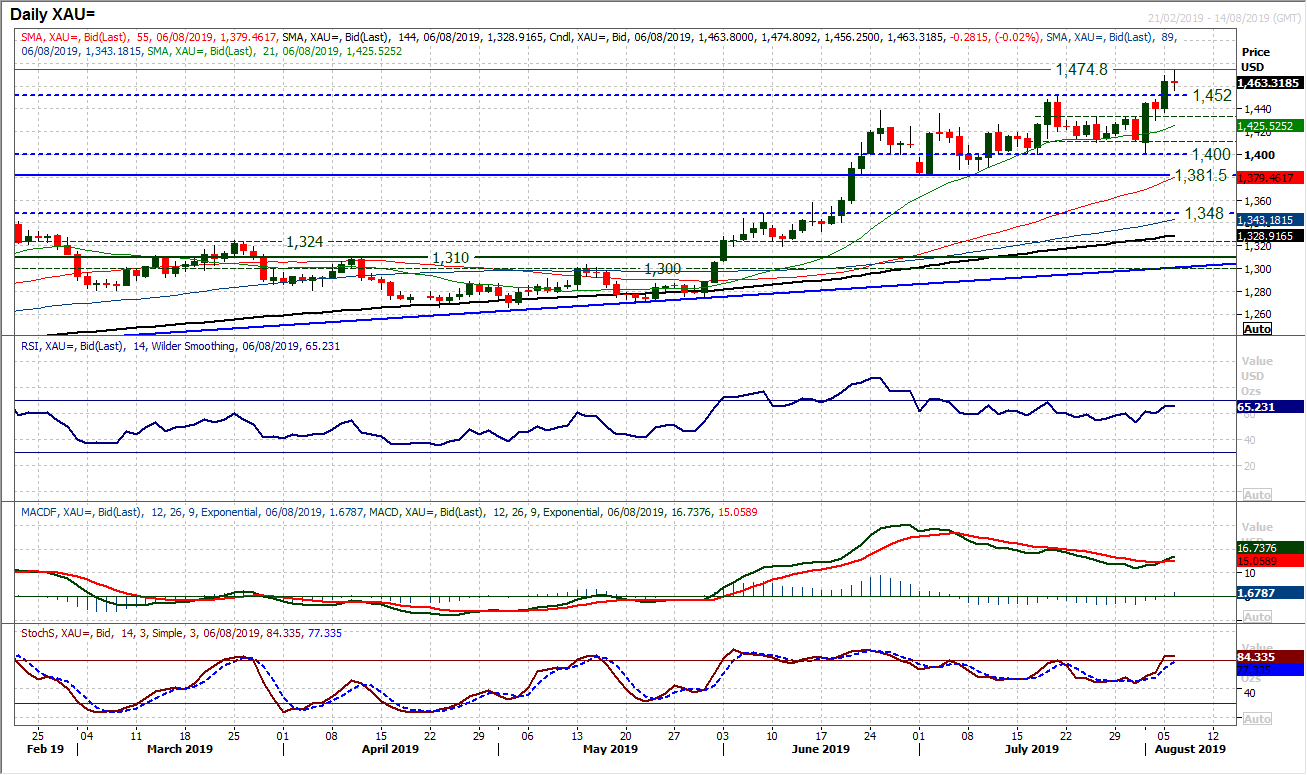
A massive breakout to multi-year highs on gold with the safe haven bias in the market coupled with corrective dollar moves. The move is now open for a test of initial resistance (a reaction high from way back in April 2013) at $1488 but in reality the next key area of resistance is the psychological $1500 level. Momentum indicators are going with the recovery, with a bull cross on AMCD above neutral and Stochastics bull cross also accelerating higher. The breakout is very strong, but the history of recent breakouts on gold is that there is often a degree of an unwinding retracement which can give a better entry level. Could this be happening this morning, with a pullback from $1474? The breakout at $1452 is the prime first area of support, with a strengthening buy zone $1433/$1452. The rising 21 day moving average has been a good basis of support in recent weeks, currently at $1425.
WTI Oil
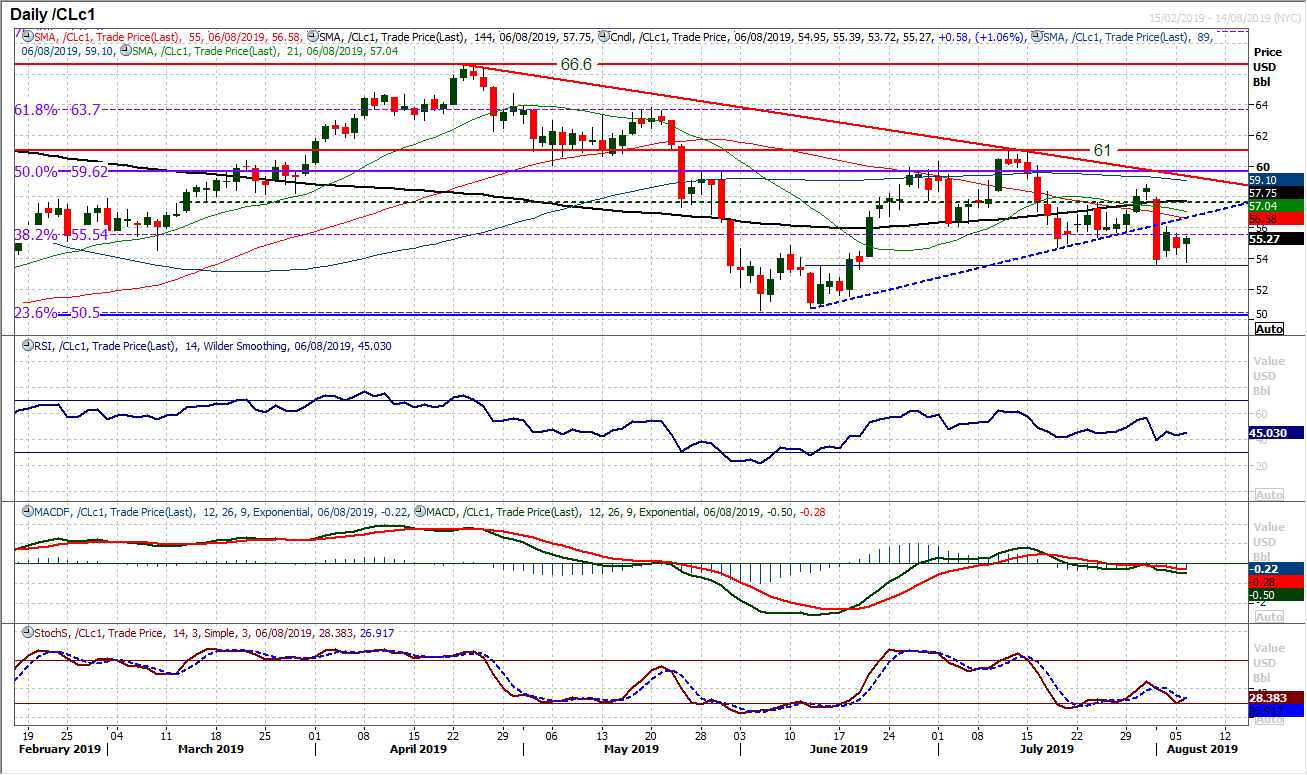
It is difficult to hold an overly positive view on oil right now, as WTI trades under all it moving averages and recently broke a seven week uptrend to trade at a six week low. The reaction to the massive sell-off from last Thursday has been a choppy consolidation underneath the old uptrend. The 38.2% Fibonacci retracement at $55.55 is also a basis of resistance too. However, the market has fluctuated in recent weeks and another pop to the upside cannot be ruled out. We would though view this as a chance to sell. We expect the recent low at $53.60 to come under further pressure in due course. Initial resistance is around $56.00 from Friday’s high.
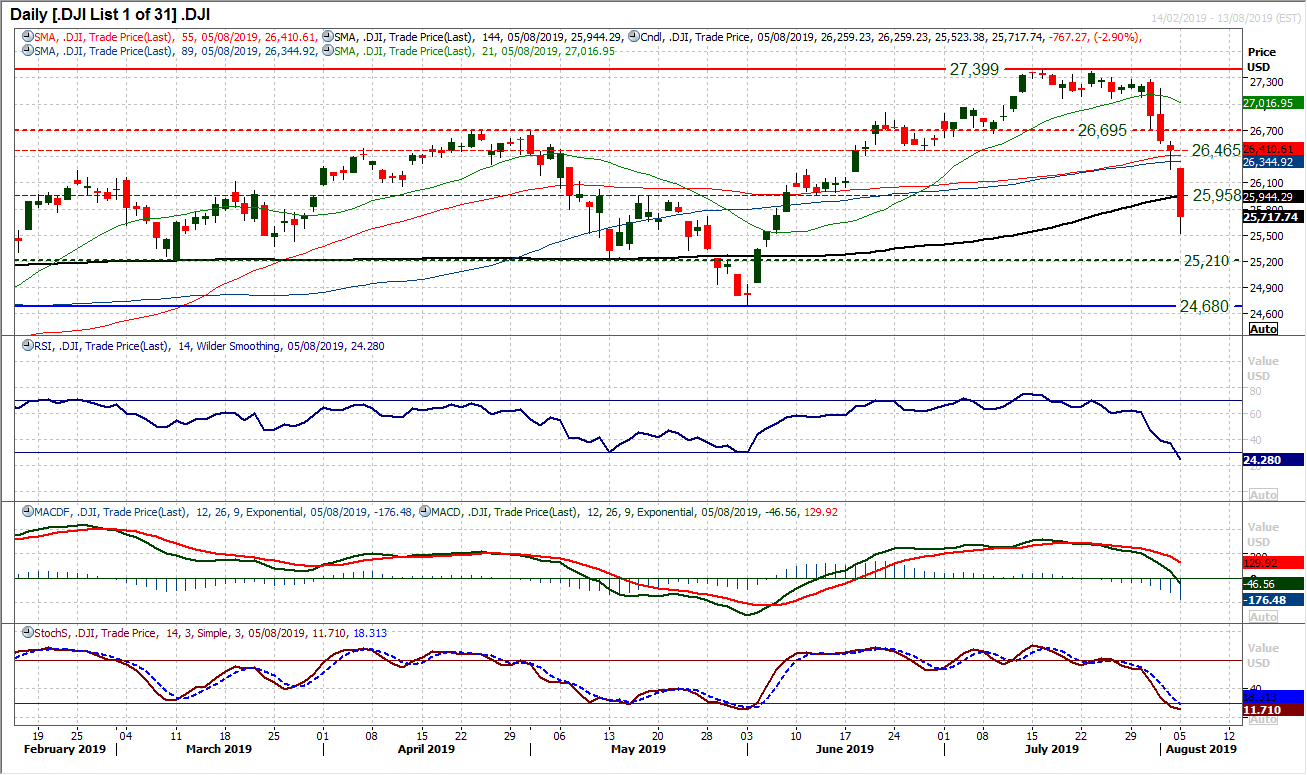
Wall Street has continued to accelerate lower as support seems to be making little impact at the moment. Another medium term pivot at 25,958 was breached yesterday as the market fell over -750 ticks and almost 3% down on the day. However, this was still off the lows of the day. US futures are a mild amount higher early today (c. +0.2%) but is this the end of the sell-off? It is far too early to be calling bottoms, with a basis of support at 25,210 and the key June low at 24,680 within sight. Momentum is still massively with the correction, but as can often be seen with these sharp sell-offs, something can switch, and very quickly a technical rebound sets in. The bulls will be hoping that the rebound in the last hour of trading yesterday is something in the offing, although the hourly chart shows little other than an oversold position so far. Initial resistance at 26,257.
"""DISCLAIMER: This report does not constitute personal investment advice, nor does it take into account the individual financial circumstances or objectives of the clients who receive it. All information and research produced by Hantec Markets is intended to be general in nature; it does not constitute a recommendation or offer for the purchase or sale of any financial instrument, nor should it be construed as such.
All of the views or suggestions within this report are those solely and exclusively of the author, and accurately reflect his personal views about any and all of the subject instruments and are presented to the best of the author’s knowledge. Any person relying on this report to undertake trading does so entirely at his/her own risk and Hantec Markets does not accept any liability. """
