Market Overview
The signs of recovery are growing. There have been fluctuations in market sentiment over how to trade the Coronavirus, but there has been a far more decisive view taken in the past 48 hours. A recovery had been threatening, as the People’s Bank of China injected 1.2 trillion yuan of liquidity to try and steady the market earlier this week. However, this move took a whole new force amidst claims of a treatment for the virus having been formulated. This sense of optimism has been added to overnight as China has announced that it would cut the tariffs on $75bn worth of US imports.The market impact continues to be to drive flow out of safe haven assets and back into risk. Subsequently, bond yields continue to climb higher, whilst the yen is slipping. A recovery in the oil price is beginning to take hold, whilst the Chinese yuan is also breaking a weakening trend.The renewed verve in equities on Wall Street has been remarkable, suddenly eyeing all-time highs again, whilst this is translating to renewed strength across other major equity markets. The big question is whether this risk revival can last. One interesting feature has been the dollar strength. Usually played as a safe haven, the dollar has continued to climb despite the renewed risk appetite. In this time of uncertainty of exactly how to play the Coronavirus, it seems that the dollar is the all-weather currency.Wall Street had another storming session, with the S&P 500 +1.1% higher, closing at 3334 within a hair’s breadth of an all-time high. US futures suggest that an al-time high will come today, currently around +0.4% higher. Asian markets have taken this confidence on board, with the Nikkei +2.4% higher and Shanghai Composite +1.7% higher. European indices are also positioned for strength today, with FTSE 100 Futures +0.4% and DAX Futures +0.5%.In forex, there is a lack of real direction, but a shade of JPY and GBP weakness is notable. In commodities, there is a basis of support for gold trading +$3 higher, whilst the big mover is a continuation in the oil rebound, around 2% higher.It is a quiet day on the economic calendar, with only really the US weekly jobless claims at 13:30 GMT which are expected to be fairly stable at 215,000 (216,000 last week).Once more we are on the lookout for central bankers today, with ECB President Christine Lagarde testifying to the European Parliament at 08:00 GMT. There will also be the FOMC’s Robert Kaplan (voter, centrist) speaking at 1415GMT.
Chart of the Day – USD/CHF
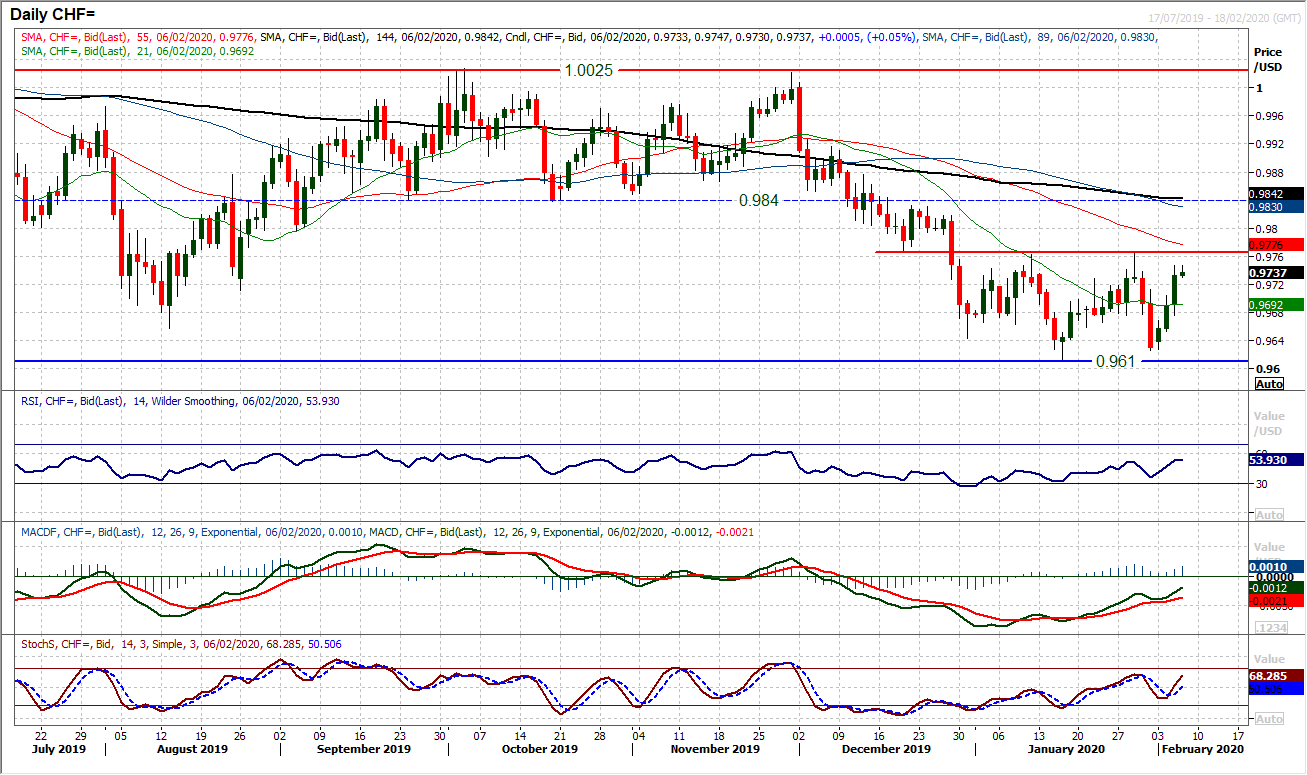
The fluctuations in risk appetite have driven significant swings on USD/CHF recently, and especially over the course of the past week. However, the moves come with an improvement in the positive momentum which suggests the bulls are positioning for a base breakout. The resistance around 0.9760/0.9765 has become the neckline for a potential six week base pattern and a closing breakout would be a key shift in sentiment. Momentum indicators have been tracking higher in recent downswings and suggest a positive outlook is brewing. The RSI is now at two month highs above 50, whilst MACD lines have just “bull kissed” higher and even Stochastics have crossed back higher to look more positive. This all suggests buying into weakness now. The immediate inference of a closing breakout above 0.9768 would be to open the key medium to long term pivot at 0.9840, although the pattern suggests an implied target of 0.9900. The hourly chart shows good support near term between 0.9700/0.9720 as a near term buy zone now. A break back below 0.9675 would defer the recovery again.
EUR/USD
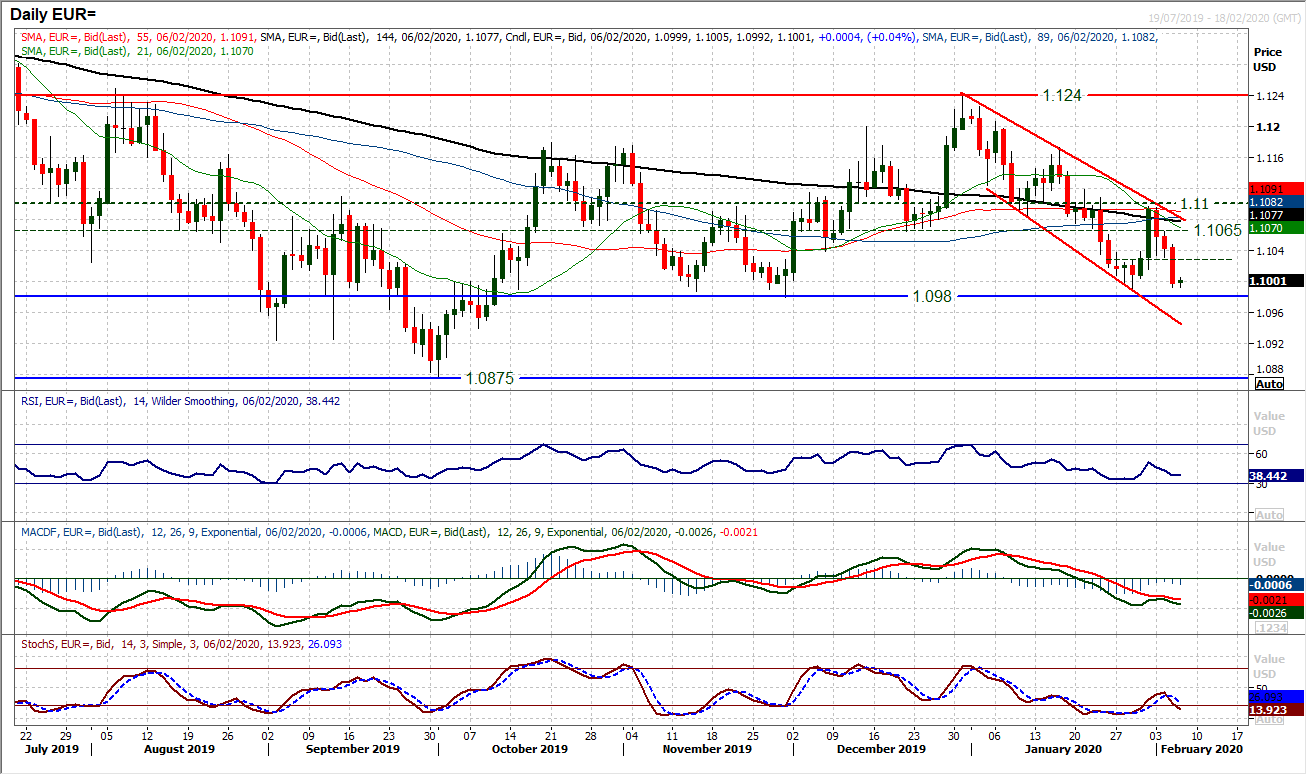
The euro has come under sustained corrective pressure in the past three sessions as dollar strength has really taken off. A resumption of the downtrend channel has been the key feature of the past few sessions, and now the market is testing the key medium term support at $1.0980/$1.0990. The risk is certainly towards a downside break. Renewed deterioration in the momentum indicators comes with downside potential. The RSI is falling back below 40, whilst MACD lines have just “bear kissed” lower and Stochastics have bear crossed lower. All of these indicators have room to fall if recent patterns come close to being replicated. A closing downside break of $1.0980 would leave the euro at four month lows and open the crucial support at $1.0875. The hourly chart shows intraday rallies are being sold into, with resistance building between $1.1030/$1.1050.
GBP/USD
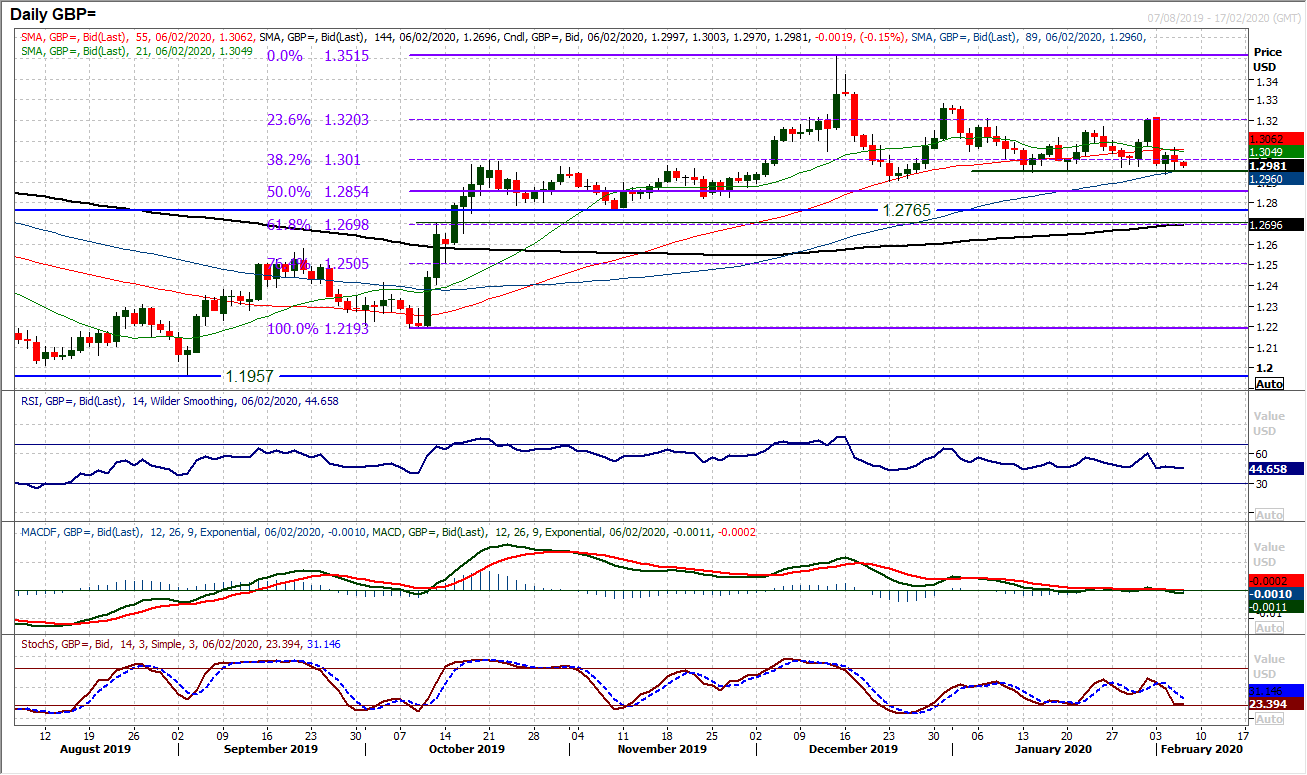
Cable continues to trade around the old key support band between the key December low at $1.2900 and the old breakout around $1.3000. It should be noted though that whilst the dollar makes considerable gains versus the euro and yen, the performance of sterling continues to hold up relatively well. On Cable, time and again, in recent weeks, support around $1.2940/$1.2960 has held firm. This has meant that a range between $1.2940/$1.3215 has formed. There is a negative bias to the range in recent sessions as the market has failed to engage a decisive rebound off the lows. However, technically there is no explicit lead towards a downside break, yet. RSI continues to hold in the 40/45 area and Stochastics are reasonably contained. A slight tick lower on MACD lines reflect the bear bias, but for now the market is consolidating. The hourly chart shows minor resistance around $1.3010 under yesterday’s rebound high of $1.3070. A close under $1.2940 would pressure $1.2900, and a close below there would be a bearish breakdown. For now though, the market is in consolidation.
USD/JPY
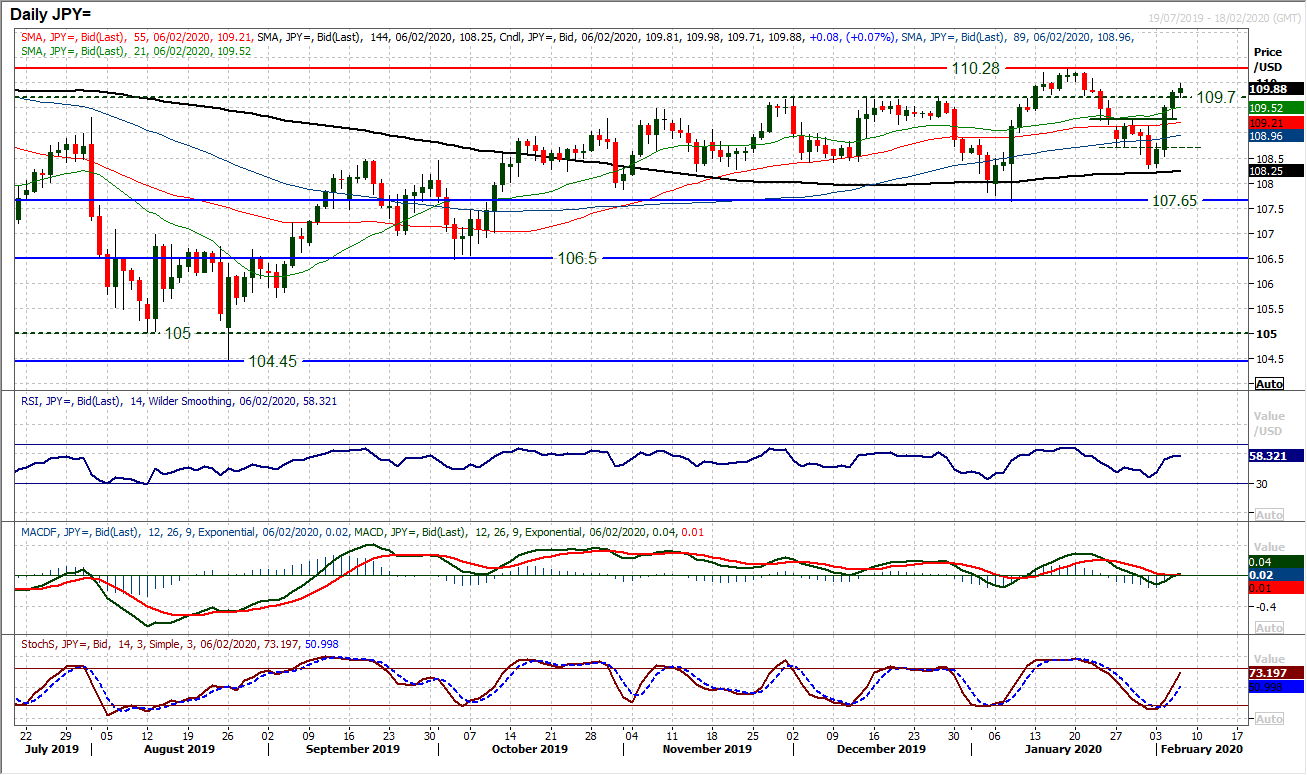
With three consecutive decisive positive candles, the bulls find themselves in the driving seat again. A decisive close above 109.70 which is an old key breakout has bolstered this outlook. There is a decisive swing back to improving momentum indicators, with the bull cross buy signal on Stochastics, being joined by a bull cross now on MACD today. The RSI is also back to rising above 50 but also with upside potential, given that previous bull legs of recent months have all taken the RSI into the mid-60s. This all suggests that intraday weakness is a chance to buy. A renewed positive near term outlook on Dollar/Yen remains intact whilst the market holds above 109.25. The near term break above 109.70 has also become a basis of intraday support this morning and the bulls will now be eyeing the resistance of the January high around 110.30.
Gold
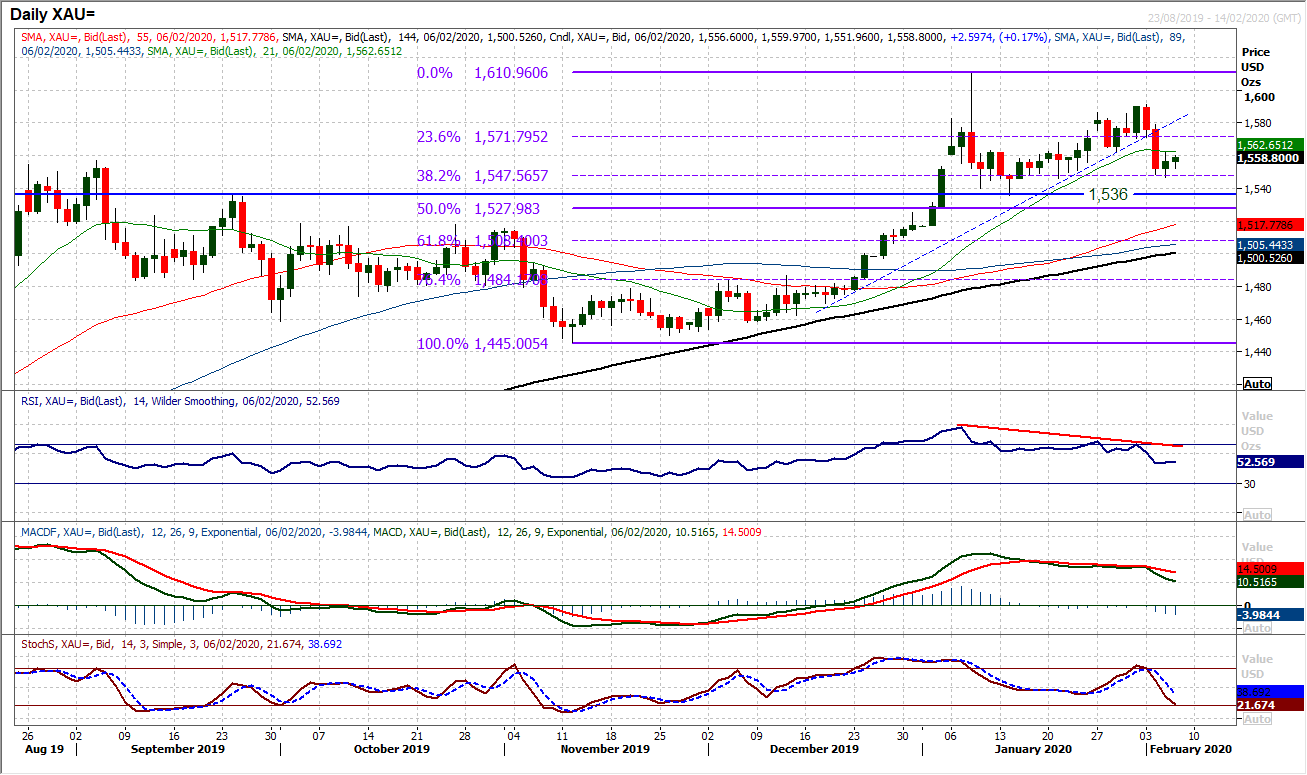
The near term outlook for gold has taken on an increasingly uncertain configuration. Key intraday swings on gold yesterday came on fluctuating newsflow surrounding the Coronavirus, and this is likely to remain the case in the coming sessions. The bulls have lost control of the recovery, having broken the multi-week uptrend. However, once more the 38.2% Fibonacci retracement (of $1445/$1611) around $1548 is notable as a basis of support. We have turned neutral near term on gold, as the market looks to now be consolidating. Whilst the support band $1536/$1546 remains intact the medium term outlook is still constructive. However, the bulls now have resistance building overhead between $1562/$1572 which is restricting them. Momentum indicators are unwinding but retain a positive medium term configuration still. Subsequently we favour buying into weakness on a medium term basis. Holding initial support at $1546 would help to renew bullish confidence.
WTI Oil
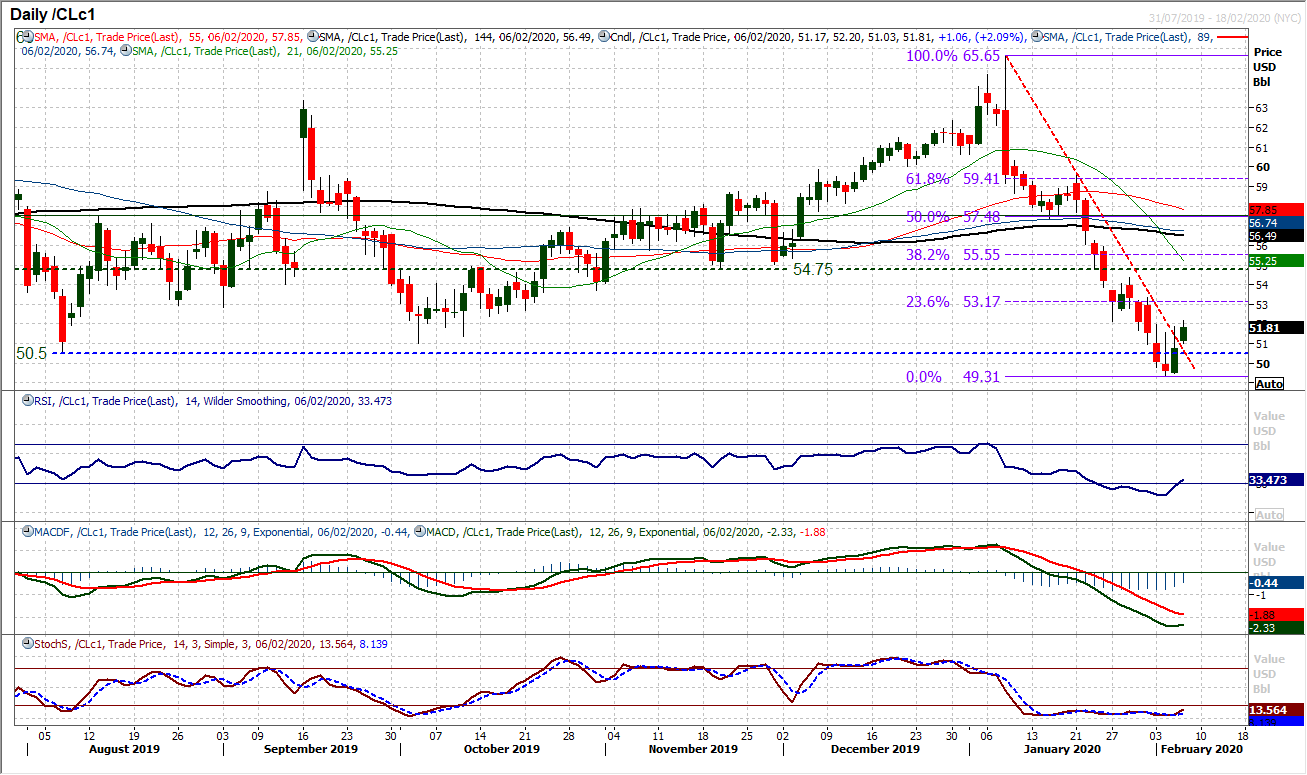
Has oil found a low? A feature of recent trading has been the numerous and consistent intraday failures as even the smallest of rallies have been sold into. However, yesterday’s positive close has been followed by early gains once more this morning as the market breaks what has been a four week downtrned. If the market can close for a second session decisively higher, then the bulls can really begin to contemplate a recovery. Technical momentum indicators are beginning to show signs of life, with the RSI setting up for a basic buy signal (back above 30) and Stochastics also beginning to pick up. Closing above $52.00 which has become a near term pivot area in the past week and a half will be an important first step. This was resistance during yesterday’s session and a decisive close clear today would open for a test of the next resistance $53.35. The old key floor around $50.50/$51.00 is initially supportive for a potential higher low above the key $49.30 low.
Dow Jones Industrial Average
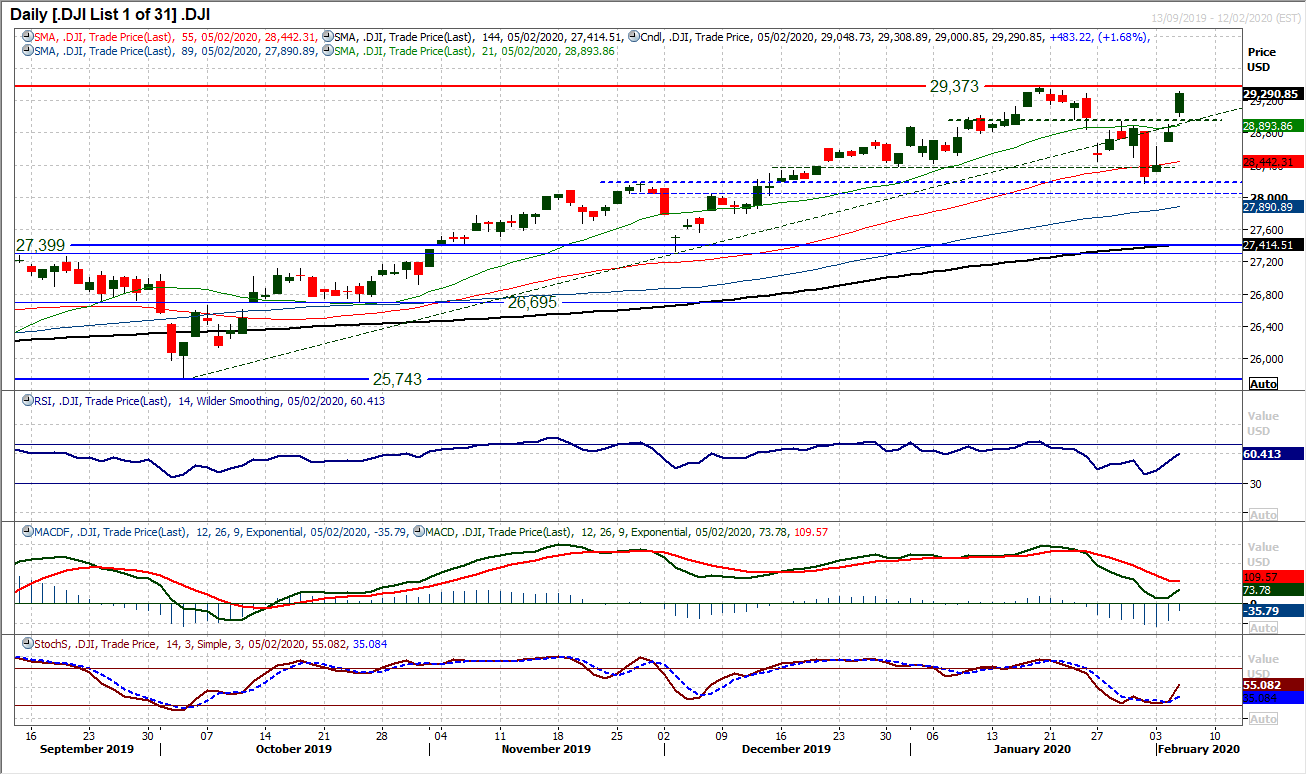
The last couple of sessions have had an incredible response from the bulls. Another hugely positive session, has seen a decisive rally to now bring the market to within sniffing distance of the all-time highs again. The corrective aspect of the two week decline which unwound around -4%, has in the space of three sessions almost entirely been reclaimed. Gapping through the pivot resistance at 28,945 leaves this now as support, whilst momentum indicators swing into positive configuration again. The improvement in Stochastics and RSI is notable, but also the MACD lines ready to cross higher above neutral is very encouraging for the bulls. The 29,373 all-time high is highly likely to be overcome today (with futures looking positive currently) so the next upside target would then be the psychological 30,000 level.
DISCLAIMER: This report does not constitute personal investment advice, nor does it take into account the individual financial circumstances or objectives of the clients who receive it. All information and research produced by Hantec Markets is intended to be general in nature; it does not constitute a recommendation or offer for the purchase or sale of any financial instrument, nor should it be construed as such.
All of the views or suggestions within this report are those solely and exclusively of the author, and accurately reflect his personal views about any and all of the subject instruments and are presented to the best of the author’s knowledge. Any person relying on this report to undertake trading does so entirely at his/her own risk and Hantec Markets does not accept any liability.
