Market Overview
After a few days of tumult across markets there is a sense of markets beginning to settle down again. Reaction to Jerome Powell’s Jackson Hole speech, followed by further uncertainty of the US/China trade dispute meant that markets were flying around the turn of the week. However, with Chinese officials shrugging at the prospect of trade talks with the US, there is an ongoing sense of resigned negativity throughout markets. This is reflected well through bond markets with the US yield curve further inverting as longer dated yields continue to fall away. The 2s/10s spread is turning increasingly negative at -4 basis points (the FOMC’s referenced inversion between 3 month/10 years is now -51bps). Lower risk asset plays continue to outperform, with the yen and gold rebounding yesterday, at the expense of higher risk, as the Aussie and Kiwi fell along with equities.
The US dollar has edged slightly higher overnight with a mild rebound on equity futures (although very tentative) and a stronger oil price, all helped by a surprisingly large API oil inventories drawdown. However, as the mood music surrounding the trade dispute remains negative, any positive moves are likely to be restricted before the safe haven plays resume their outperformance.
Wall Street fell marginally last night with the S&P 500 -0.3% at 2869 but this is being regained today with the US futures +0.3% early today. Asian markets have been mixed with the Nikkei +0.2% and Shanghai Composite -0.2%. European markets are cautious in early moves, with FTSE futures and DAX futures all but flat.
In forex, there is a mild USD positive bias across major pairs, with the commodity currencies once more the key underperformers, whilst GBP is also dropping back slightly after yesterday’s decent gains. There is a mixed look to commodity markets with gold just giving back some of yesterday’s gains, whilst silver continues to push on strongly. Oil is a further 1% higher today after yesterday’s surprise drawdown on the API inventories.
It is a quiet day on the economic calendar with little of any note until the EIA oil inventories at 15:30 BST which are expected to show another crude oil drawdown of -2.1m barrels -2.7m barrels last week). With distillates there is expected to be a mild build of +0.8m (+2.6m build last week), whilst gasoline stocks are expected to drawdown by -1.0m (+0.3m build last week).
It will also be interesting to keep an eye on a German 10 year Bund auction of after the recent struggle to get the 30 year Bund away.
Chart of the Day – AUD/JPY
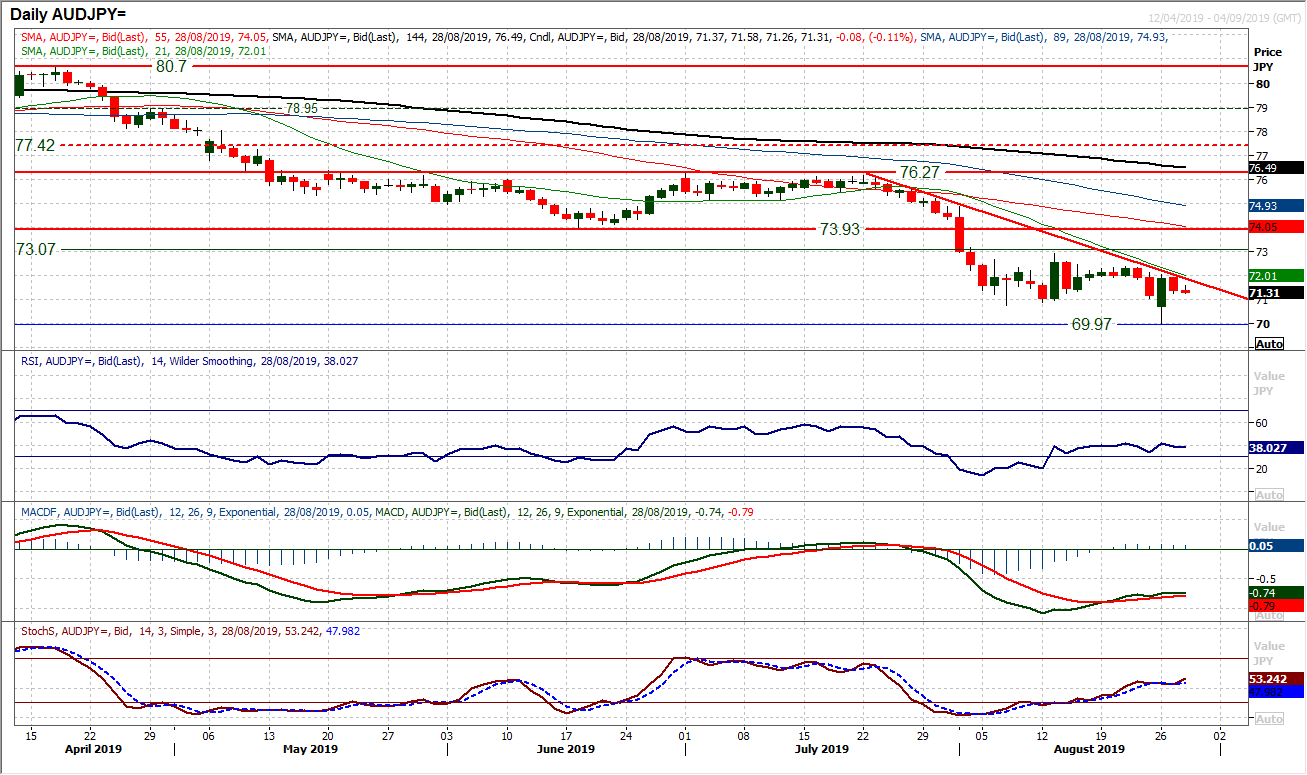
The bigger picture continues to be one of muted risk appetite, something which is pulled yen outperformance across the major crosses. Subsequently, the negative trends of the past five weeks continues to weigh on AUD/JPY. The latest consolidation briefly broke down on Monday only for an intraday rebound to pull the market higher into the close. However, with yesterday’s failure of this rebound, it is a move that is being sold into again. The momentum indicators are struggling for traction and the failure of the August consolidation to break back above the historic 73.07 floor (which is now resistance) suggests that the rallies are a chance to sell. Lower highs are forming now with last week’s 72.40 under the 72.90 and the five week downtrend re-asserting yesterday (comes in today at 71.90). The hourly chart shows the RSI consistently failing 60/65, so we would be looking for another lower high under Monday’s rebound high of 72.05. A move back under yesterday’s reaction low at 71.25 would open the downside once more. Initial support at the spike low around 70.00 but with the market trading around 10 year lows, the flood gates have now been opened.
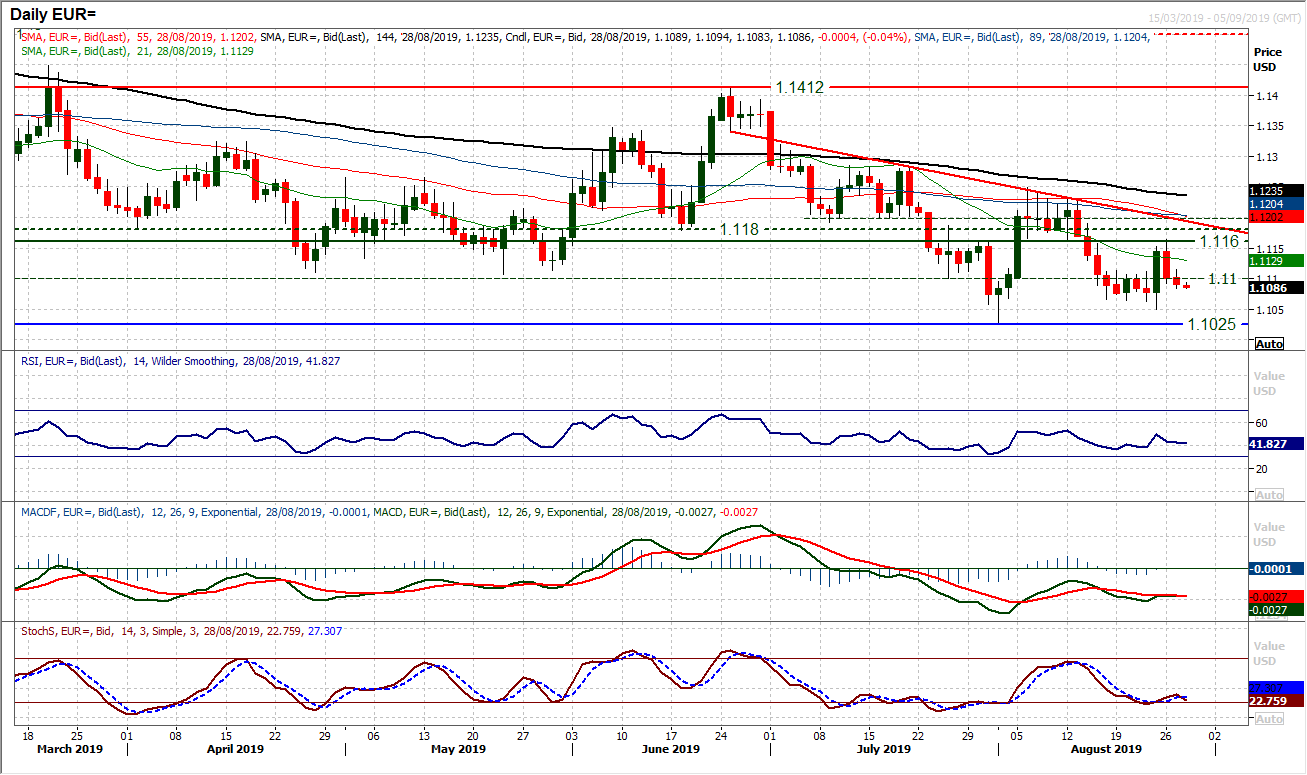
With the market trading under all moving averages which are falling in bearish sequence there is an ongoing negative bias to EUR/USD. The failure in the resistance between $1.1160/$1.1200 band of overhead supply adds to this. Although there is a negative bias to momentum indicators, they are also fairly settled. This points towards rallies fading and a bear drift rather than any substantially sharp selling pressure. The initial support at $1.1050 is still likely to be tested in due course, whilst the key low at $1.1025 has been in place for around four weeks now. We favour selling strength, but also are mindful that there is limited downside traction.
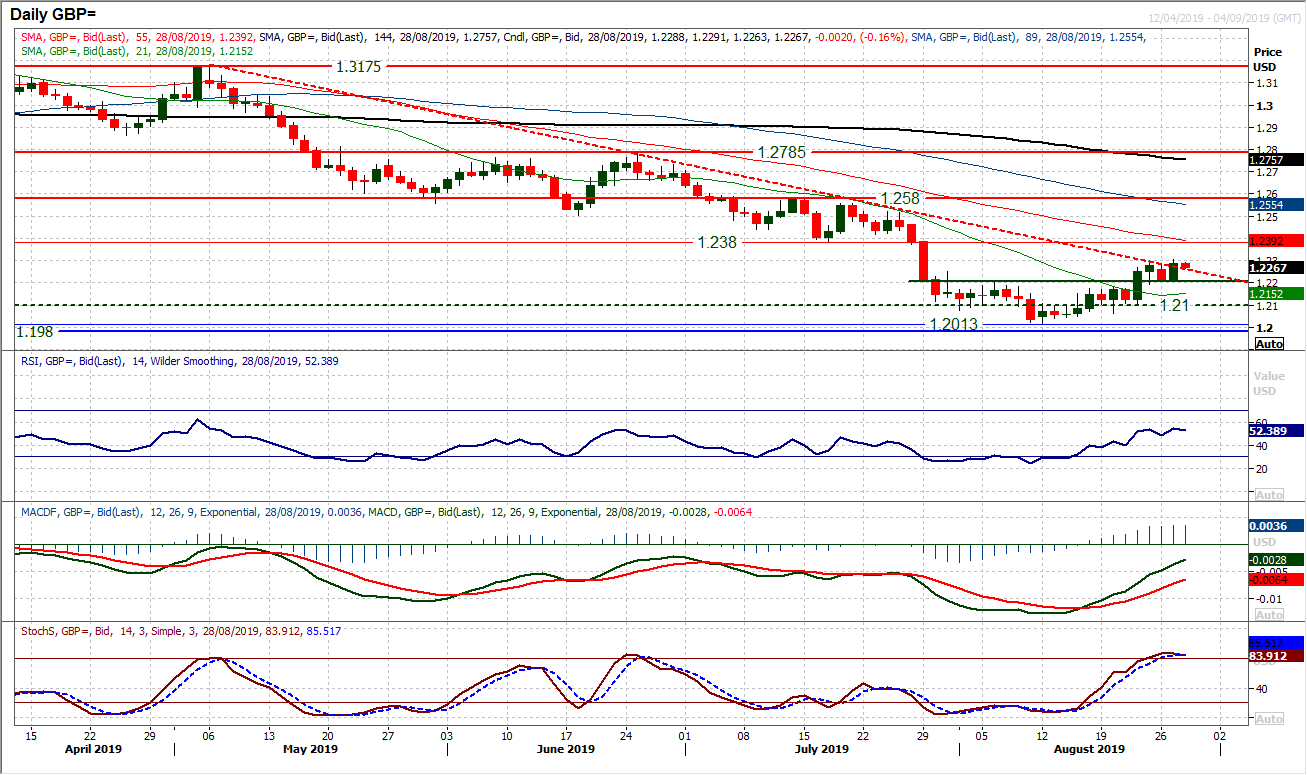
It is interesting to see that sterling is holding firm in its move towards a near term recovery. This is now to the extent that a sixteen week downtrend is being breached. Having broken out above $1.2200 last week this breakout is now becoming a basis of support. We spoke previously about the $1.2210/$1.2250 (old highs) resistance being a neckline for a near term reversal, and not the market looks to be building from this. The implied recovery is around 200 pips. We do still see this as a bear market rally and as such targets (ie. a 200 pip upside target) tend to underwhelm. This suggests that the $1.2380 old key low is within scope for a realistic target. A second consecutive positive candle today above $1.2305 (yesterday’s high) would set the market on its way towards the target. There is good near term support now between $1.2195/$1.2210.
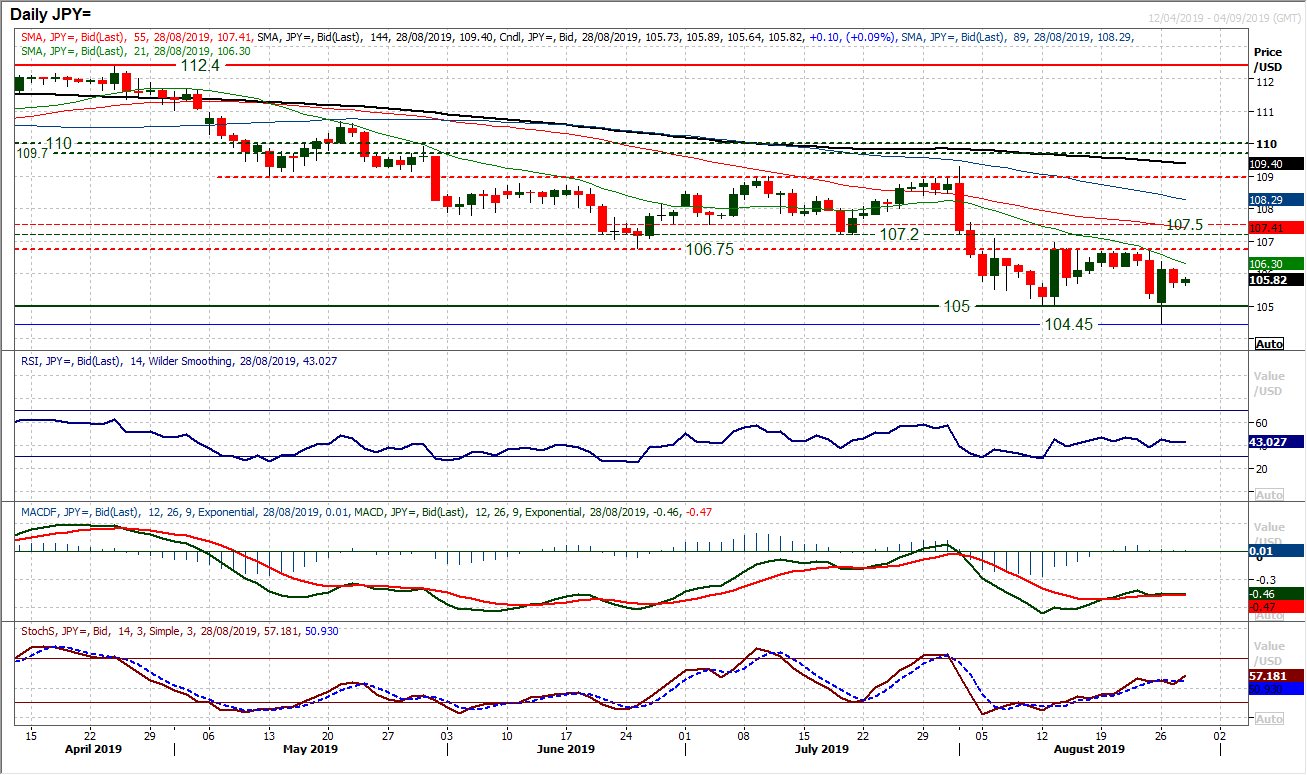
Whilst the bears could not decisively regain control yesterday, there is still a sense that the market is ready for the next leg lower. The resistance around and just above 106.75 is heavy and the struggle of the unwind on momentum indicators suggests that the bears are just waiting for the next signal to sell. The RSI continues to struggle in the mid-40s, whilst MACD lines are stuttering and Stochastics are beginning to fall over around 50. Although there is intraday support from yesterday’s low at 105.60 and the market has ticked higher this morning, we expect rallies to fade and the pressure to continue lower. With the 21 day moving average (currently 106.30) becoming resistance, look for pressure towards 105.00 once more.
Gold
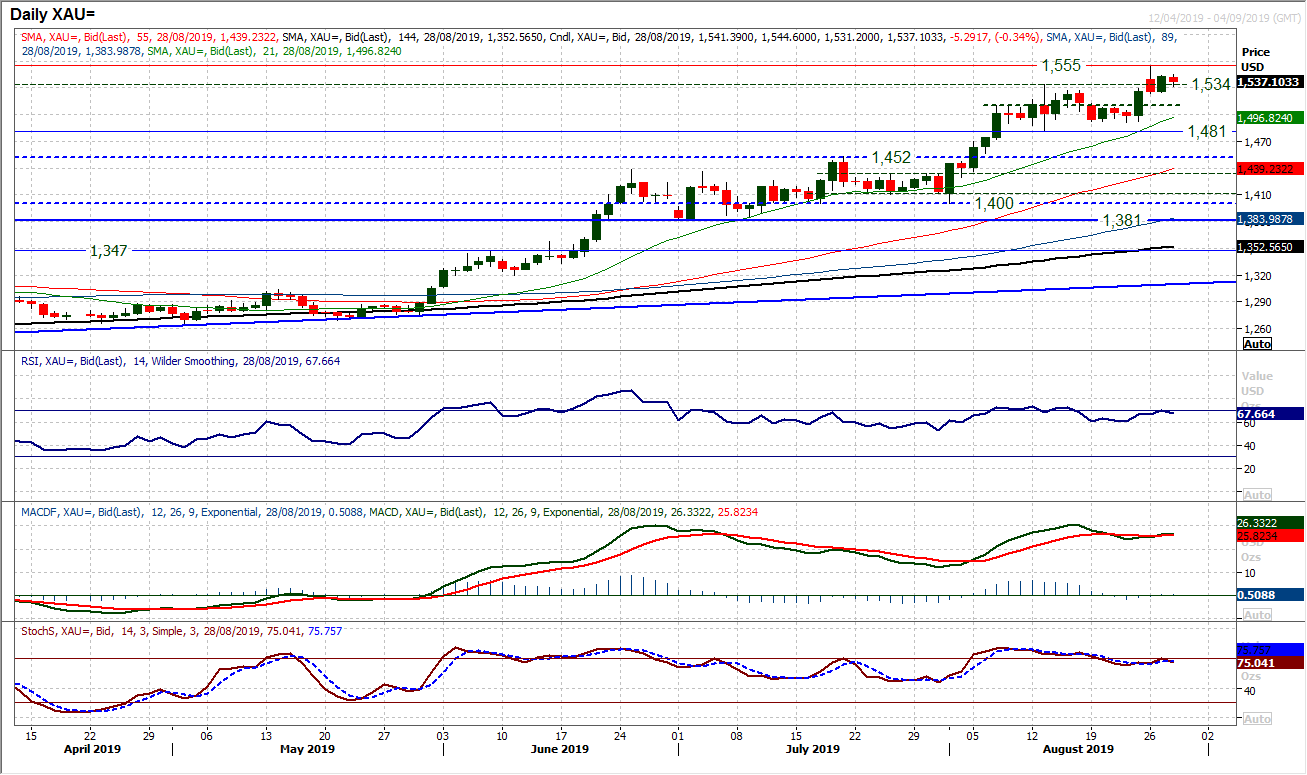
Despite the failure of the bulls to hold the breakout above $1534 on Monday, the disappointment seems to have been short lived. A solid positive candlestick from yesterday reflects the continued appetite to buy into weakness. The move is also bringing gold to its highest close since April 2013. All of this helps to leave a run of higher lows. The reaction lows at $1481/$1492 are being left as key support now as the rising 21 day moving average (currently $1497) as a basis of support accelerates higher. Momentum is taking on renewed strength but with added upside potential too. The hourly chart shows support at $1510 (the old mid-range pivot) but now also building at $1525 and means that $1525/$1534 can be considered a near term buy zone. Initial resistance at $1555 but there is little reason to not expect further gains in due course.
WTI Oil
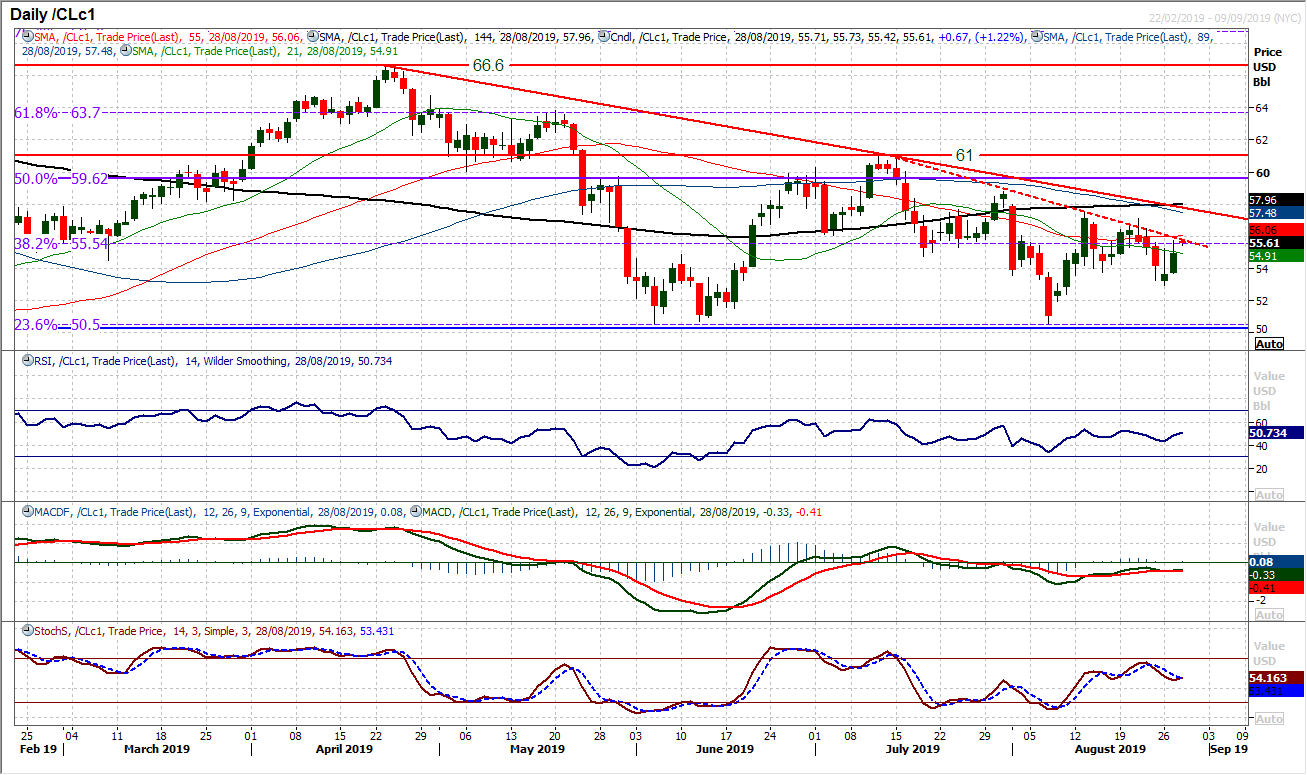
A strong intraday run higher into the close yesterday has given another opportunity on oil. For months now with the formation of downtrends, rallies have failed at lower levels. With momentum indicators negatively configured, the RSI failing between 50/55 and MACD lines consistently below neutral, this all points towards bear control of the medium term outlook. Subsequently, near term rallies will struggle and be seen as a chance to sell. A six week downtrend sits at $55.80 under a four month downtrend which sits at $57.80 today. Last week’s resistance at $57.15 added to resistance at $57.50 as the August high. We expect this rally twill therefore fade and pressure to resume on this week’s low at $52.95.
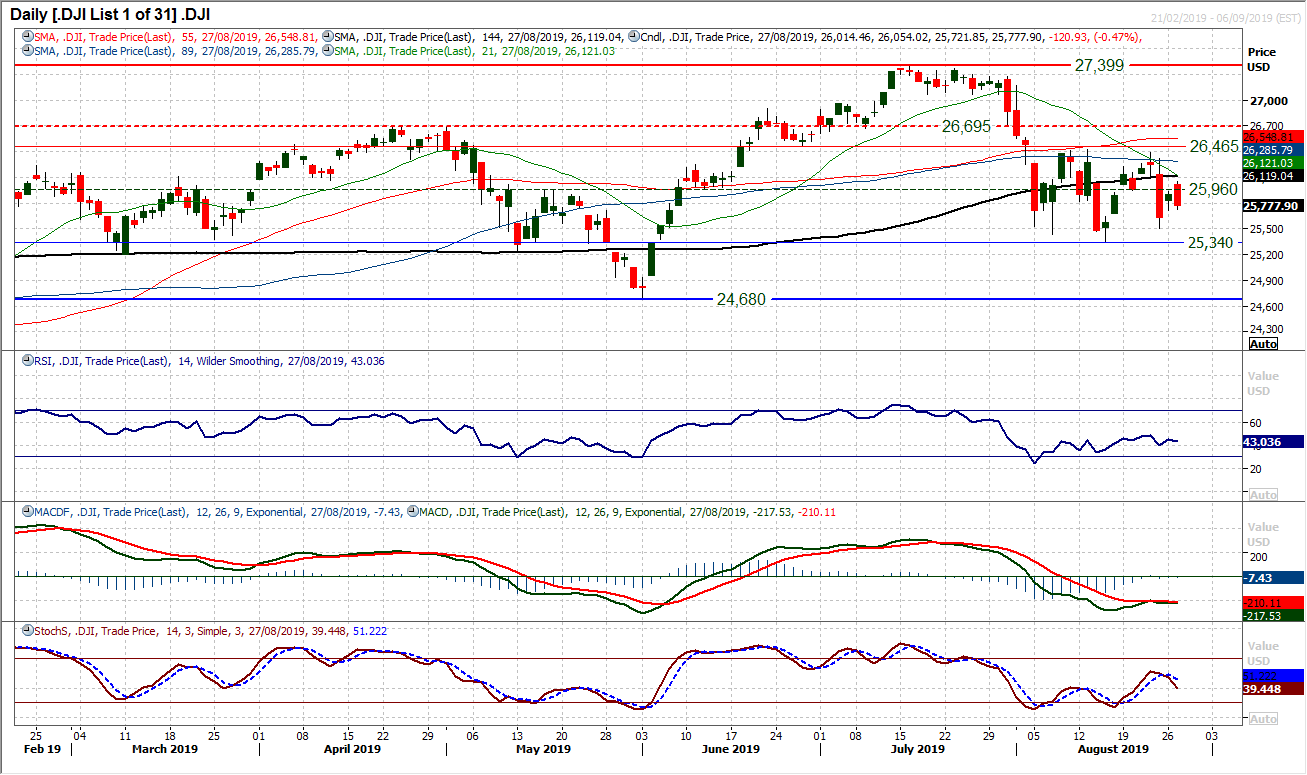
The uncertainty surrounding market direction continues. This was encapsulated well by yesterday’s session where the market opened solidly higher only to sell off to close solidly lower. The daily bar was a bearish outside day. With regards to the outlook there is an increasing indecisive three week range formation. Momentum indicators have lost their near term recoveries and have rolled over. The concern is that this now highlights what has become a medium term negative configuration. RSI below 50, MACD lines rolling over under neutral and Stochastics bear crossing around 50. This lends a bear bias to the range and pressure on support looks likely now. Initially, Monday’s low at 25,715 is under scrutiny but if this is breached the 25,507 low and then the key low at 25,340. Yesterday’s high at 26,055 is initial resistance.
"""DISCLAIMER: This report does not constitute personal investment advice, nor does it take into account the individual financial circumstances or objectives of the clients who receive it. All information and research produced by Hantec Markets is intended to be general in nature; it does not constitute a recommendation or offer for the purchase or sale of any financial instrument, nor should it be construed as such.
All of the views or suggestions within this report are those solely and exclusively of the author, and accurately reflect his personal views about any and all of the subject instruments and are presented to the best of the author’s knowledge. Any person relying on this report to undertake trading does so entirely at his/her own risk and Hantec Markets does not accept any liability. """
