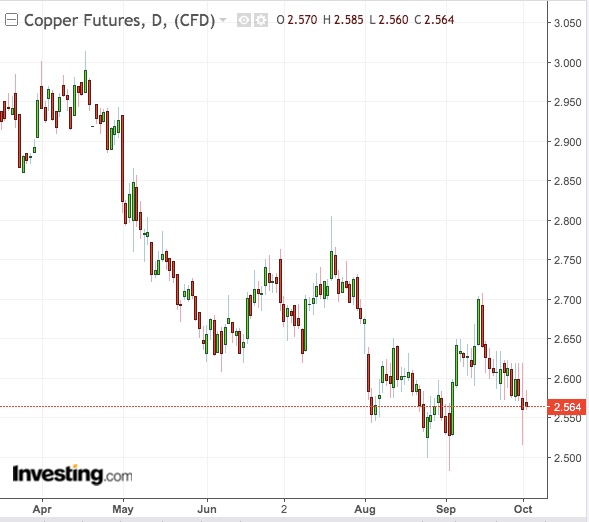
Treasury spreads and yield curves have become the most common ways to tell a potential recession now. But not too long ago, there was another instrument that traders relied on for this: copper.
Used in construction to power generation to circuity of cellphones and almost every electronic device, “Dr. Copper”—as the red metal is still fondly called by some commodity veterans—enables those who study it well the ability to “diagnose” a slowdown way before it arrives.
Copper Not Getting The Attention It Deserves

To those analysts, sliding prices of copper have been screaming “Recession!” well before the yield curve inversion in 10-Year and 2-Year Treasurys deepened earlier this year. Only that copper hasn’t got the attention it deserves, as there are more “exciting” metals like gold and palladium to consume investors’ interest these days.
In Tuesday’s trade, copper futures posted another decisive bottom after The Institute of Supply Management flagged U.S. factory activity at a 10-year low, underscoring a continued slowdown in the goods-producing sector.
Benchmark copper for December delivery on the New York Mercantile Exchange’s Comex division slumped to a one-month low of $2.515 per lb on the ISM data. It did recover slightly before the close to settle at $2.5606, down 0.7% on the day.
Red Metal’s Price Could Be On The Cusp Of Another Breakdown
To Eric Scoles, metals strategist at RJO Futures in Chicago, traders should not be taking their eyes off copper now as it is on the cusp of another breakdown that would point to an even more vulnerable state of the economy.
Said Scoles in a recent note:
“There is a support point at $2.483. If prices break below and close under this level, a major sell off is likely.”
“It’s also important to note there is a gap on the weekly chart from 2016, and as the old-adage goes: ‘The gap is meant to be filled’. For traders this could become a significant bearish opportunity; for those who deal in physical copper this could be the time to hedge.”
Investing.com’s Daily Technical Outlook has a “Strong Sell” call on copper, projecting a downside as low as $2.469 in the near-term.
Edward Meir, a veteran consultant for copper at INTL FCStone in New York, was quoted saying in the Wall Street Journal that the ISM data intensified worries about a broad U.S. economic slowdown, baked into copper prices.
Manufacturing Slowing Down Everywhere
The WSJ noted that other major economies have also experienced a slump in manufacturing, putting further pressure on copper, which is used to build everything from office buildings to electric vehicles.Added Meir:
“When you have every major manufacturing hub slowing down, metals consumption will suffer as a result.”
Scoles said copper hasn’t been been given its due attention lately as a foreteller of the economy:
“Typically, when discussing the likelihood of an oncoming recession and referencing futures markets, you will hear a whole lot about Treasurys spreads and yield curves. However, what has been standing out to me is the copper charts.”
“Why? Because copper represents construction, it represents industry, and its demand is strongly correlated with economic expansion and growth globally.”
Scoles said that if the developing chart pattern indicated the potential for copper prices to fall dramatically and for an extended period, it would not be because of an explosion in production, but rather the shriveling of demand.
He added:
“If economic expansion directly increases demand and drives the price of this commodity up, then what (will) push it down will likely be economic recession.”
Will A U.S.-China Trade Deal Come Quick Enough To Avert A 'Wildly Bearish' Bear Market?
To Scoles, Chinese demand was what has been driving copper in either direction, and fundamentals were supportive of a bear market in the metal unless the United States reached a trade deal with China in the near future.
He noted that the December copper futures chart indicated a market that could be stuck in a massive multi-year head-and-shoulders pattern forming between November 2016 and current day fluctuations.
That, according to him, shouldn’t be ignored:
“Dec. 19 copper is becoming wildly bearish from a technical perspective as the massive multi-year head and shoulders pattern on the weekly chart looks near complete.”
