A 15% rally in silver prices now comes in days, not months
As of Monday, the price of gold has seen a modest decline, with the troy ounce currently valued at $2022.00 USD, maintaining stability.
Previously, gold exhibited a lateral trading pattern but ultimately ended the week with a slight uptick in its value.
The ongoing speculation about a potential decrease in interest rates in 2024 remains a pivotal factor in sustaining high gold prices. Should the Federal Reserve maintain a cautious approach, it is likely that gold will continue to hover around its current value.
Furthermore, upcoming U.S. GDP data is of significant interest. If early-year data does not indicate robust economic growth in the U.S., it could serve as a catalyst for a shift in gold prices.
Gold price chart technical analysis
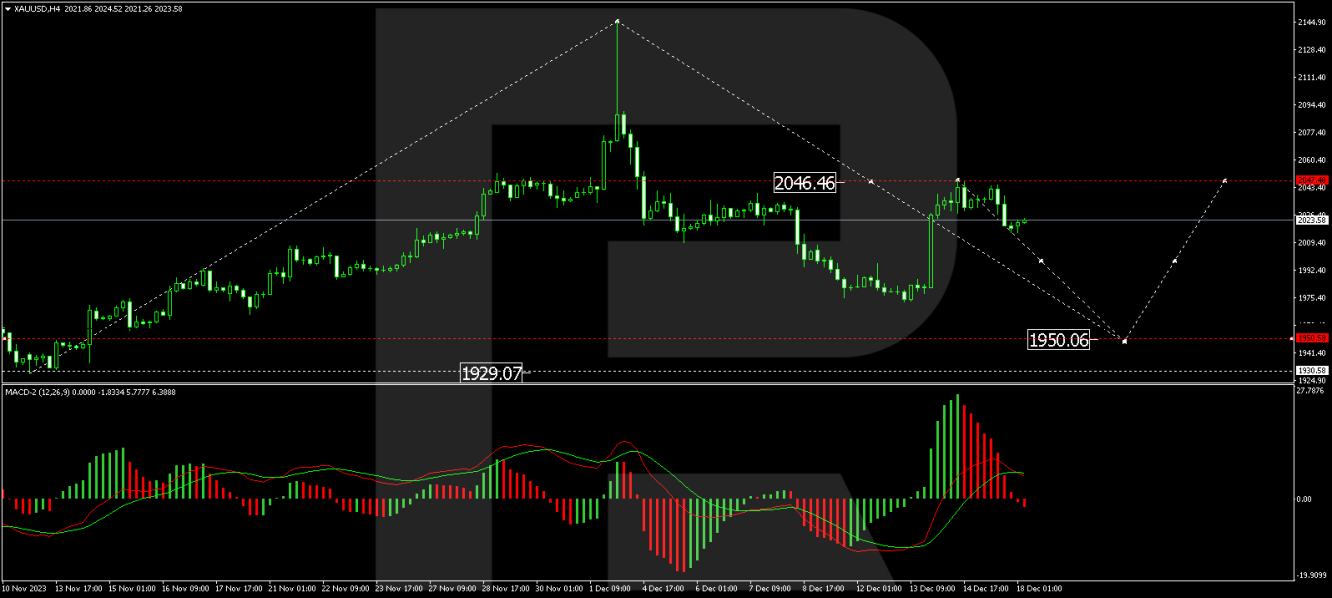
The XAU/USD H4 chart reveals that gold's price has recently completed a downward movement to $1973.00, followed by a corrective rise to $2047.85, resulting in a consolidation phase below this level. However, the market has since broken out of this range, descending further. Currently, a downward trend towards $2006.66 is in progress, and if this level is breached, a further decline to the primary target of $1950.00 could occur. The MACD indicator supports this outlook, with its signal line above zero and a clear downward trajectory.
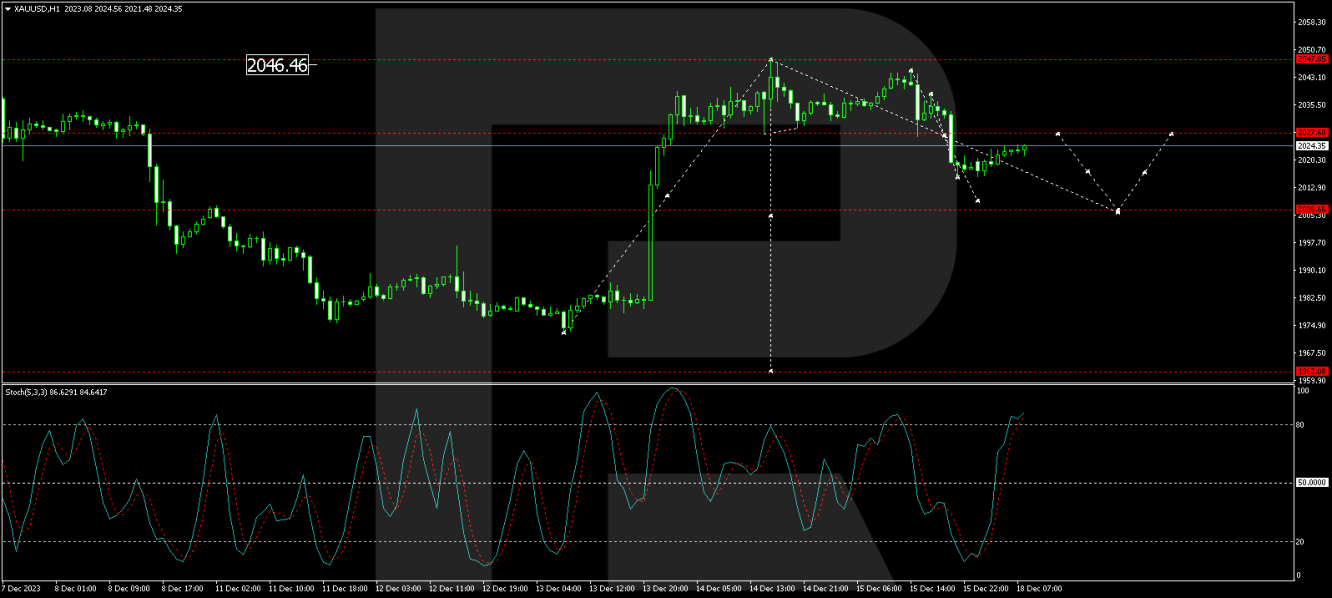
On the XAU/USD H1 chart, the formation of a downward wave heading towards $2009.00 is observable. Upon reaching this level, a corrective increase to $2027.60 may occur, followed by a subsequent decline towards $2006.66. From this point, the trend could extend down to $1950.00. This technical scenario is corroborated by the Stochastic oscillator, which shows its signal line below 80 and is directed sharply downwards towards 20.
By RoboForex Analytical Department
Disclaimer
Any forecasts contained herein are based on the author's particular opinion. This analysis may not be treated as trading advice. RoboForex bears no responsibility for trading results based on trading recommendations and reviews contained herein.
