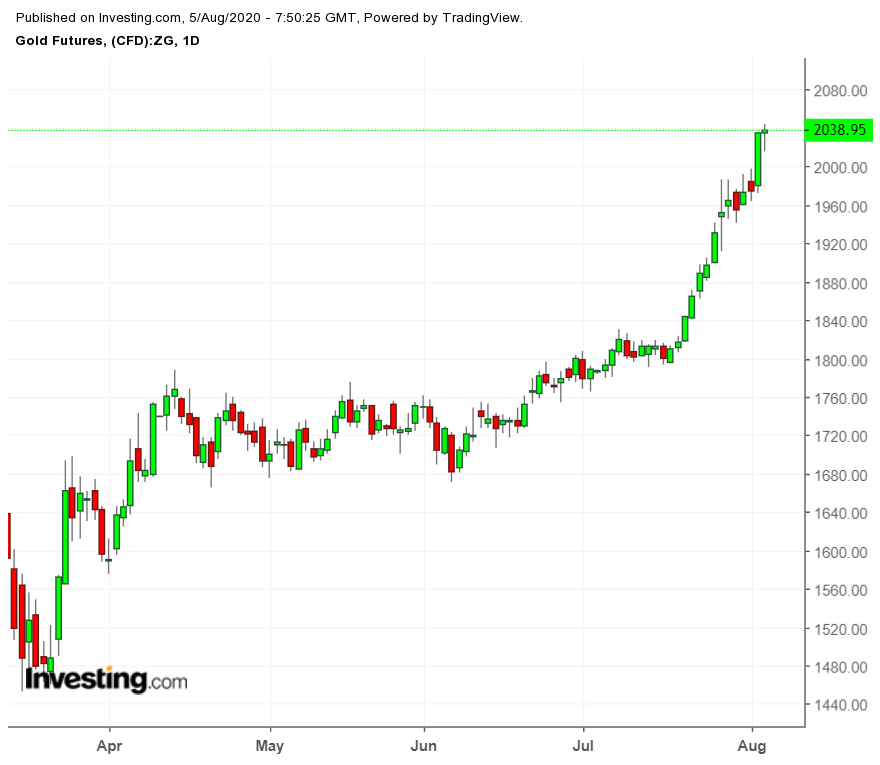
Where in the world is gold headed? With US gold futures setting one record high after another—the latest above $2,052 an ounce on Wednesday morning in Asia—everyone is trying to answer that question.
And as simplistic as it sounds, the yellow metal’s rise or fall from here is almost entirely dependent on one thing: the dollar.
For, after all the insightful charts, and fancy candlestick and Fibonacci readings, gold’s value, like that of any commodity, is determined by supply and demand.
And for precious metals, which are invariably in limited supply compared to other raw materials, an additional layer applies: the supply of money, which determines the value of currencies like the dollar.
The US Dollar Index, which ties the value of the greenback to six other currencies, was at 17-year highs of 103.960 in March. The dollar stood rock solid then as equities crashed at the height of coronavirus fears, creating a chronic need for cash to cover margins in stocks that, in turn, led to run on gold—the best asset one could liquify under pressure to raise money. Gold, consequently, fell to a 4-month low of $1,451.00.
Blame It On Plunging Yields, Real Rates And The Dollar
Fast forward to August: The Dollar Index is now at 27-month lows of 93.047, battered by plunging US 10-year yields and real rates into deeper negative territory, as well as the issuance of more than $3 trillion in US coronavirus relief funds since March, and counting.
One need not be a Harvard economist to understand the inflationary impact of all that money supply on the dollar down the road, investor fears about the health of US balance of payments and why everyone’s looking at gold to hedge away at least some, if not all, those concerns.
At the time of writing, the October gold contract on New York’s COMEX had set a record high of $2,038.95 by early Wednesday afternoon in Singapore, after settling Tuesday’s regular trade in New York at $2,001.20, with a session peak at $2,014.15.

Even more scintillating was the performance of COMEX’s December gold contract, which has attracted higher volume and open interest than front-month October. December gold reached a record high of $2,055.40 on Wednesday morning in Singapore.
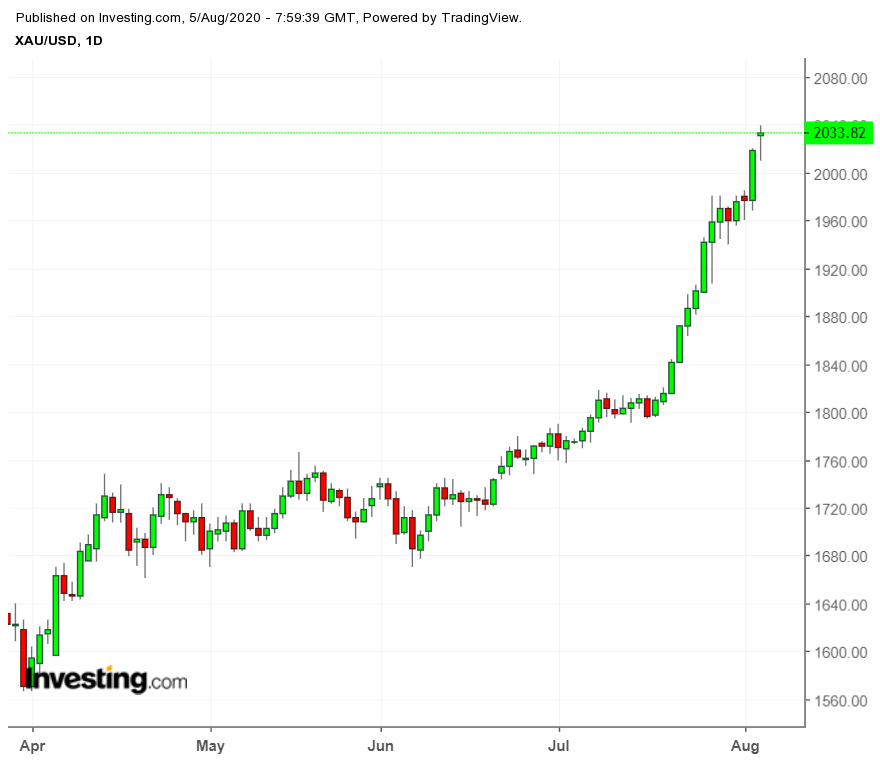
Spot gold, which reflects metal available for immediate delivery, meanwhile, hit a record high of $2,039.90 Wednesday morning.
Gold At $2,150 Looks Achievable Next
Given the continued tumble of the dollar and gold’s virtual ascendancy to $2,050 an ounce, I’m inclined to think that $2,150 would be an achievable near-term target on the COMEX, possibly before the end of this month. In line with the market’s focus and activity, this will likely happen on the December contract before it does with front-month October or spot gold.

I’m not alone in making this call.
AG Thorson, an expert in the study of gold’s technicals, said a continued breakdown below 92 on the Dollar Index could trigger what he called a “waterfall decline.”
“In this scenario, gold would likely extend above $2,100 and enter a parabolic rise,” Thorson wrote in a blog posted Wednesday on FX Empire.
Sunil Kumar Dixit, an independent analyst in precious metals, said gold was displaying a “measured Fibonacci move” of the previous record high year of 2011 where it went to $1,920 versus the low of 2015, when it hit $1,046.
He added that this showed a 123.6% retracement level—which was rare—and marked the metal’s next ascendancy to $2,127, “though buoyancy is likely to match $2,150 as a strong case.”
Thorson said in the past, a dip below 20 in the daily Relative Strength Indicator of gold characterized an interim cycle low.
With the RSI reading reaching 18.61 on July 30, “the odds for a potential bottom in the dollar and temporary spike high in gold are significant within the next several days,” he wrote.
But in the same breath, he had a word of caution for gold bulls, that the market was getting increasingly heavy at the top. “I see the potential for increased volatility this week,” he said.
Not A Time To Short Gold, Say Analysts
Yet, Christopher Lewis, another analyst who blogs at FX Empire, expects gold bears to be defeated at most points of the market’s current momentum.
“It is not until we break down below the $1,800 level that I would consider shorting this market, or if perhaps the Federal Reserve started changing its overall attitude,” Lewis wrote.
“I do not see that happening anytime soon, so it is very likely that we will continue to see plenty of buying opportunities and I am simply going to be patient enough to take advantage of them as they occur. Until something changes, shorting is not even a thought.”
Eli Tesfaye, precious metals strategist at RJO Futures in Chicago, said he expects the Dollar Index to crumble below 90 in the coming months, priming gold for highs way above current levels.
“We’re going to have a lot of latecomers come into gold and they’re going to try and push the market higher,” Tesfaye said, concurring with Lewis.
“A lot of trend following systems will come in. Lots of stops are going to be pulled and shorts squeezed.”
Silver Target Seen At $30
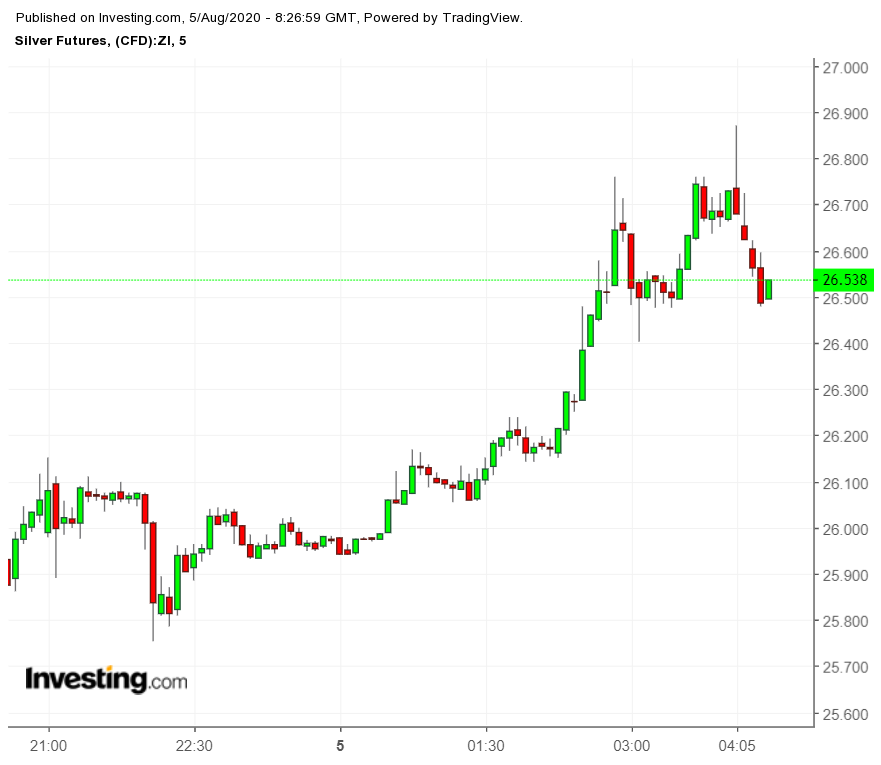
Tesfaye also projected that silver, which hit a one-week high of $26.87 Wednesday morning for the front-month September contract on COMEX, could steady at around $30 by the year-end.

Tesfaye said:
“I think silver is still very cheap relative to gold, and you’re very, very likely to see $30 silver in the next few months."
He also pointed to another interesting evolution with the silver market: The dwindling discount between the front-month September and nearby October contracts, which indicated a potential return to “backwardation” from the current “contango” situation. In commodities, a backward-dated market, where the current month was at a premium, was a signal of strength. At Tuesday’s settlement, September was at a discount of just 6.3 cents to October, versus the more than 18 cents difference on Monday.
Dixit, the independent precious metals, also has $30 silver in his view.
Dixit wrote:
“Silver is resisting 38.2% Fibonacci retracement on long time frame ranging from the 2011 record high of $49.79 to the 2020 low of $11.62 which sits at $26.18."
He said silver has confirmed a breakout above the “pennant formation in short time frame” that targets $30.11.
Dixit added:
“This also coincides with the Fibonacci 50% retracement at $30.20 and this is a high probability scenario."
