Market Overview
As we come towards the end of 2019, it seems that there is a positive bias to the macro picture that has been dominating market sentiment throughout the year. Donald Trump supposedly had a “very good talk” with President Xi of China and that a formal signing of a trade deal (phase one) would be signed “very shortly”. Perhaps in a sign of fatigue, markets have reacted with a shrug of the shoulders. We have been here before, and there is always the potential for a “buy on rumour, sell on fact” reaction. However, this should only be a short term response, as confirmed positive traction and a floor under the trade tensions will set markets on a far more constructive path for risk appetite in 2020. What is curious is that the opposite of what might have been expected is reflected in price moves this morning. Gold is breaking out to six week highs,
Treasury yields are lower and equities are struggling. It is Christmas week, so liquidity will be lower, and this can create some erratic moves, however this is still somewhat counter-intuitive. The dollar is weaker slightly and this could help to explain some of the move in gold.
Wall Street closed at all-time highs once more on Friday, with the S&P 500 +0.5% at 3221. US futures are all but flat, with Asian markets mixed. The Nikkei was flat but the Shanghai Composite fell -1.4%. European indices are shading lower in early moves, with the FTSE futures -0.2% and DAX futures -0.1%. In forex, there is limited direction early today, although there is a mild USD negative bias across major currency pairs.
In commodities, the precious metals are making the moves, with silver over 1% higher and gold up $6 (+0.4%). Oil is a shade lower after a strong run of recent gains.
There is one interesting US data point to keep an eye out for on the economic calendar today. US New Home Sales are at 150;0 GMT and are expected to improve marginally by +0.3% in November to 735,000 (from 733,000 in October).
Chart of the Day – Silver
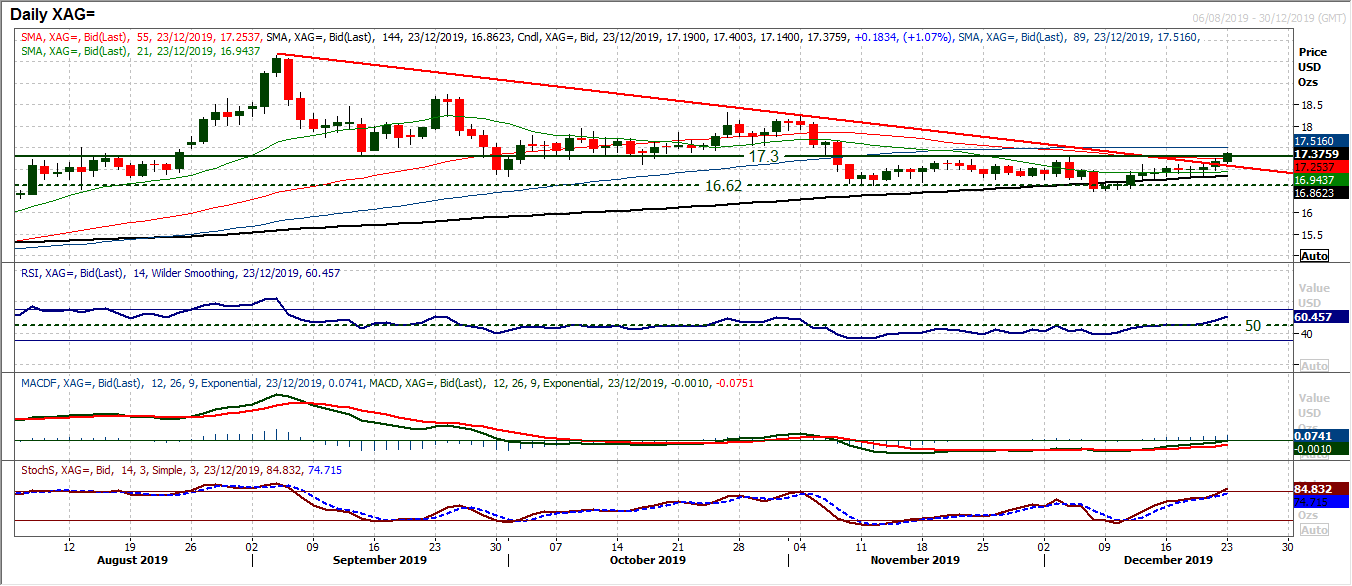
In the desperate search for direction (any direction) on precious metals, silver could be the one to give an early signal. Gold remains stuck under resistance, but there was an interesting move on silver in Friday’s session that has continued early today. A positive candle on Friday saw a close above $17.12 for a two week high. In isolation this may not sound like much, but it included a breach of a 15 week downtrend, and also finally signs of traction in the RSI. The main caveat is that silver gave a false signal two weeks (a false downside break). However, unlike now, momentum indicators were not confirming that time. This time, the RSI has broken out at a six week high along with Stochastics moving into bullish configuration. The key test for a silver recovery would be a closing breakout above $17.30. This is being eyed today. Momentum is suggesting the buyers are beginning to get more confident. Closing above $17.30 opens $18.23. The hourly chart shows a buy zone now $17.00/$17.12. Last week’s higher low at $16.84 (above $16.50) is now a higher low and supportive.
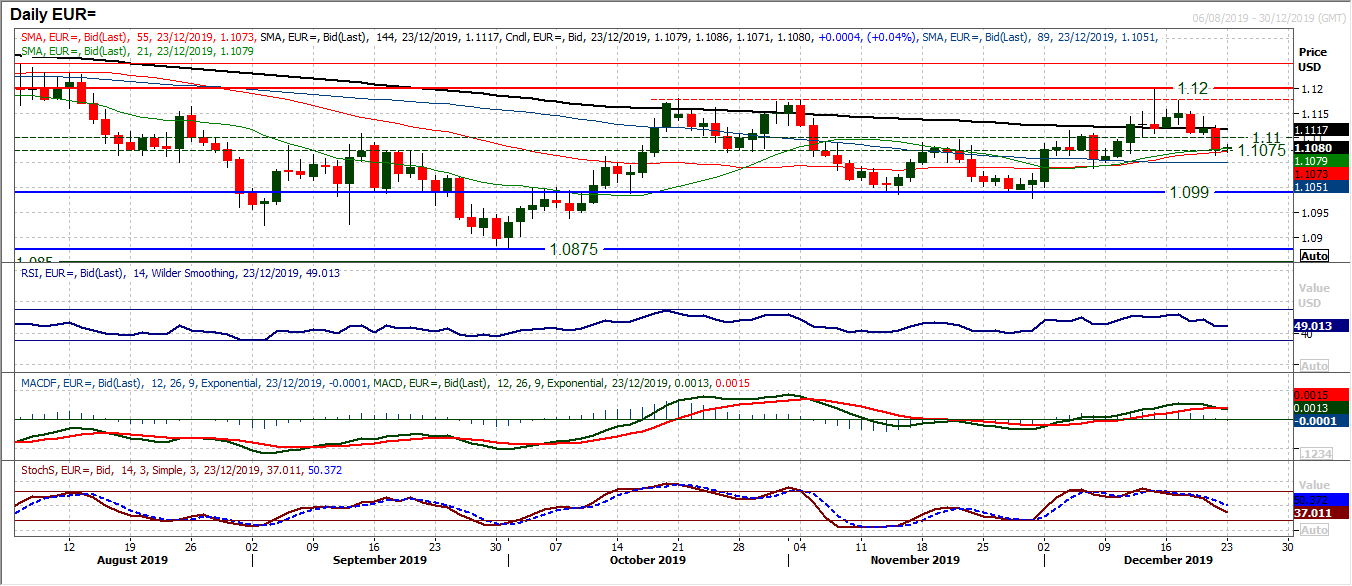
The euro is beginning to yield under growing corrective pressure. Since the early December rally failed around the resistance of the top of the two month trading band $1.1180/$1.1200, the selling pressure has been growing. Lower highs and lower lows with negative candles becoming more prevalent. We have been looking at the pivot band $1.1075/$1.1100 as being mid-range (the absolute range parameters being $1.0980/$1.1200). However, this band is under growing strain. Breached by a strong bear candle on Friday, momentum signals are now corrective. The MACD lines are bear crossing and Stochastics falling below neutral to two week lows. Momentum is growing for another retreat towards the $1.1000 area again. $1.1100/$1.1110 is a pivot resistance area now that the bulls need to overcome to prevent this growing corrective move. The only caveat is whether the lack of conviction of Christmas week helps to support the euro?
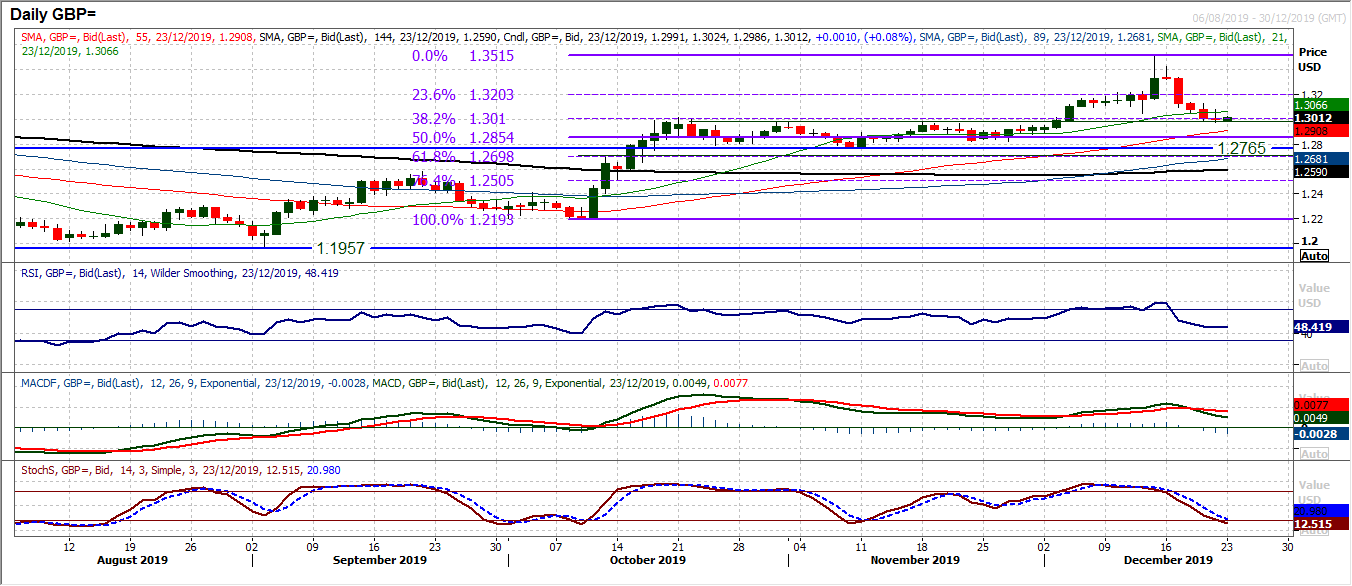
Sterling had its worst week for over three years last week. Losing over -330 pips this was the biggest correction since the October 2016 flash crash. However, the selling pressure was abating slightly into Friday’s close and there is a degree of support now forming around the 38.2% Fibonacci retracement (of $1.2193/$1.3514) at $1.3010. Considering this was the key breakout support of the old highs $1.2975/$1.3010, this is an important support area for the bulls to protect. Momentum indicators have been corrective on the recent decline, but are also around key levels now. RSI needs to hold around 50 (a shade below now), MACD lines above neutral and Stochastics now back around key turning levels (of previous months). Volatility is still elevated (although this is likely to subside into Christmas week) but breaking the run of lower daily highs is needed. Resistance at $1.3080 from Friday. For a sense of support (and possible recovery) to build, hourly RSI above 60, and MACD above neutral. A close below $1.2975 continues the retracement, with the 50% Fib at $1.2850 and support at $1.2820.
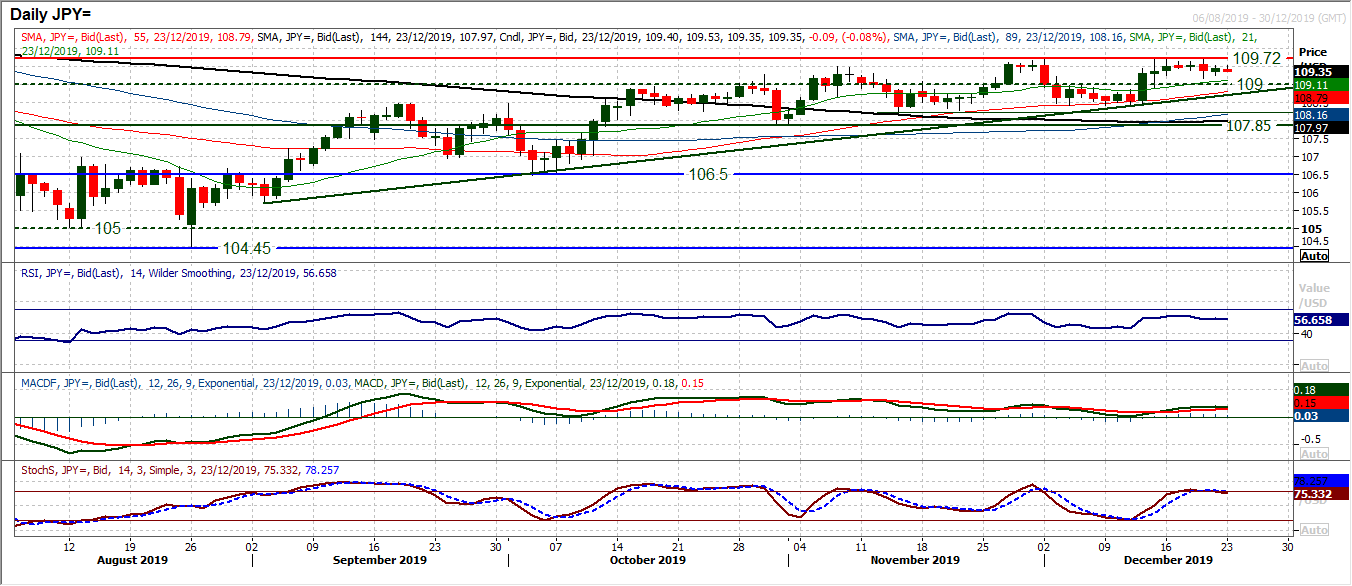
We retain our positive medium term outlook on Dollar/Yen but are concerned that another near term corrective slip could be underway. This move would still be seen as a chance to buy, but also reflect the uphill battle that the bulls face to achieve any real gains. There is an uptrend since September that comes in at 108.70 today, whilst we also see the 109.00 breakout as an area of support. This is therefore a buy-zone between 108.70/109.00. The 55 day moving average is also a basis of support around 108.80. What makes Dollar/Yen so difficult to call is that there is a number of contradictory near term candles (moving into Christmas week this is hardly likely to get any better). The resistance at 109.70 remains intact and momentum indicators have lost positive traction but equally are not in retreat. The run of higher highs tells us that the bulls will struggle for traction even if a breakout above 109.70 is seen. Further resistance at 109.90 and the May high of 110.65 is key.
Gold
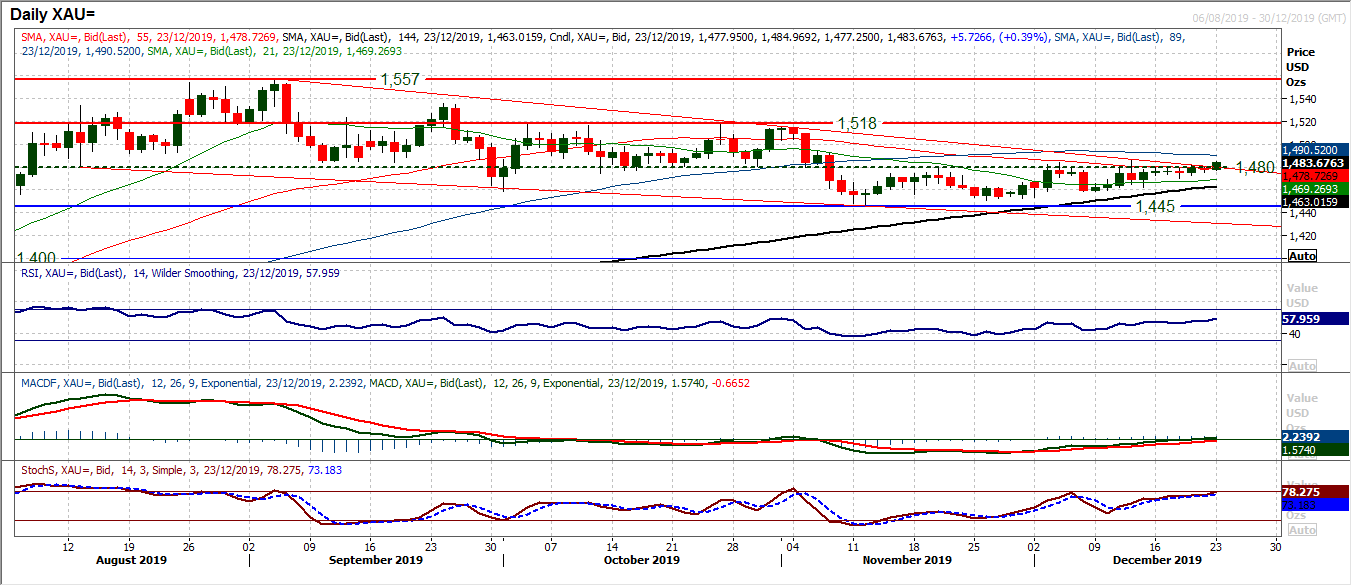
Gold tested the resistance around $1480 every day last week, only for the overhead supply (of trading throughout August to October). However, as we have seen silver breaking out above its equivalent resistance, gold is now looking to follow suite. Is this the moment that gold pulls higher through the crossroads? Today’s early move above $1480 is encouraging, but it needs a closing break above $1487 to really break the shackles. Time and again, intraday moves above $1480 have faltered into the close. Having been stuck in the low 50s last week, momentum indicators are beginning to look more positive. The RSI needs to close in the 60s to really suggest traction, and MACD lines decisively above neutral. A close above $1487 would effectively be a breakout and confirm the end of a range (from around $1445/$1480). It would open the psychological $1500 level again, with the prospect of a move back towards the $1518 key resistance. Gold could be finally finding direction, but a closing breakout is all important.
WTI Oil
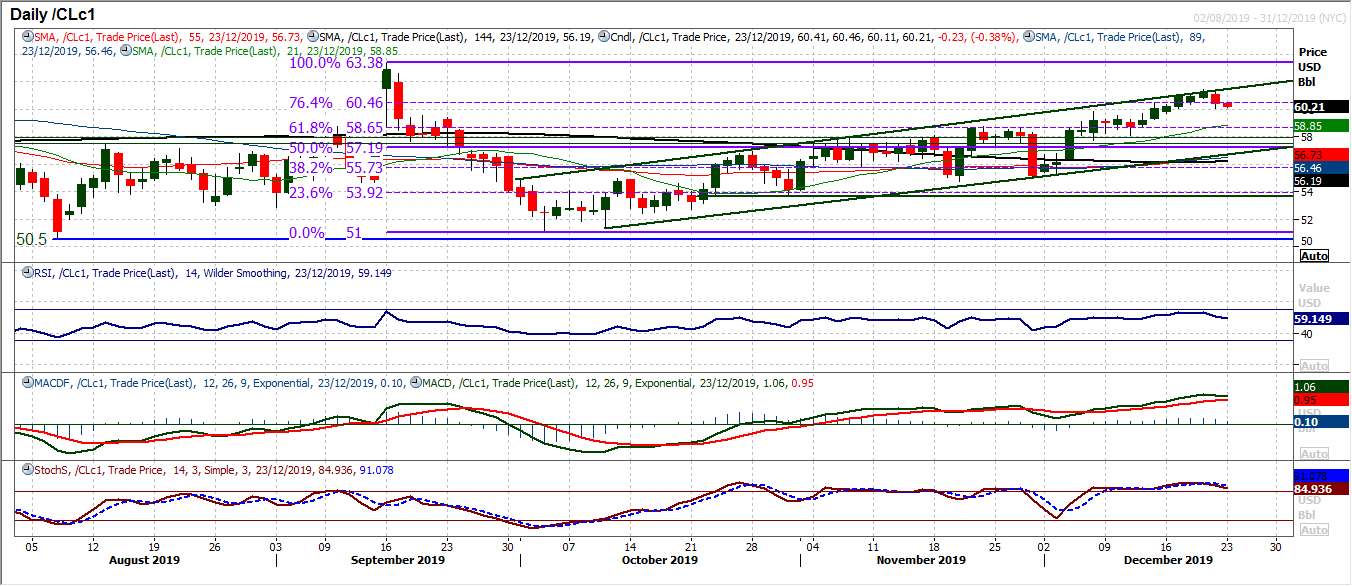
After a decent run of successive positive candles, the bulls have finally run out of steam and the retracement is kicking in. This is still an uptrend channel and still a market to buy into weakness. So, given the low liquidity (could induce some erratic trading this week) there could be some opportunities. We see good support around breakouts between $57.85/$58.65 which have formed a good band of support. The bottom of the channel rises up between $56.70/$57.00 this week. The RSI unwinding back towards 45/50 has been a good opportunity too. Resistance is at $61.50 initially now and around the top of the channel (which is now at $61.50 today).
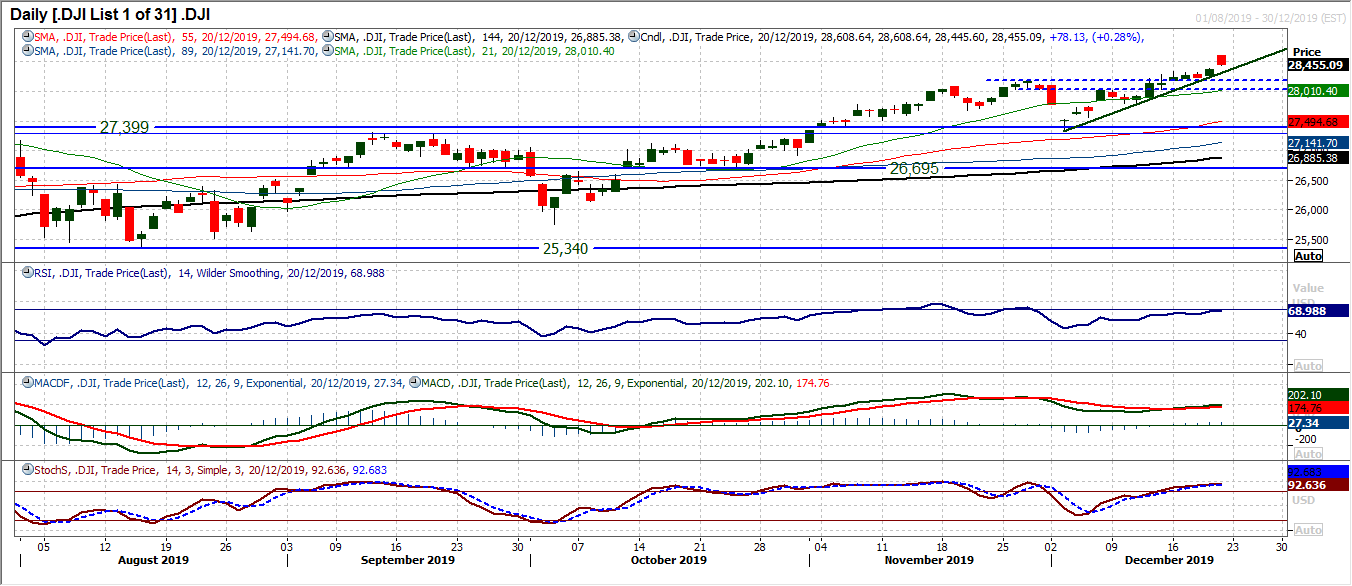
Moving into late 2019 the Dow continues to break new high ground. However, the latest candlestick poses a few questions for the bulls. Having gapped sharply higher at the open, the market pulled back over -150 ticks to close around the day low. A solid negative candle suggests the bulls come into a very low volume/low liquidity week with questionable near term control. The gap is open at 28,381 and it will be interesting to see how it gets filled. Momentum has been strong recently, so we would be confident that a near term correction would still be a chance to buy. The support band 28,035/28,175 is still a good area for the bulls, whilst above 27,800 there is still bull control. Initial resistance now the all-time high at 28,608.
"""DISCLAIMER: This report does not constitute personal investment advice, nor does it take into account the individual financial circumstances or objectives of the clients who receive it. All information and research produced by Hantec Markets is intended to be general in nature; it does not constitute a recommendation or offer for the purchase or sale of any financial instrument, nor should it be construed as such.
All of the views or suggestions within this report are those solely and exclusively of the author, and accurately reflect his personal views about any and all of the subject instruments and are presented to the best of the author’s knowledge. Any person relying on this report to undertake trading does so entirely at his/her own risk and Hantec Markets does not accept any liability. """
