European equities have managed to hold their ground this week, brushing off the bearish sentiment seen last week after French President Macron called for a snap election. The surge in right-wing support in France unearthed concerns about fragmented politics in Europe, which could lead to a rise in Euroskepticism. This sent markets into a frenzy, with bond yields spiking and equities tumbling.
The French CAC 40 took the brunt of it as expected. However, the negative sentiment spilt over to most other major equity indices, including the German DAX 40 and the EURO STOXX 50. Sentiment has stabilised this week allowing the momentum to recover slightly but the pressure remains tilted to the downside.
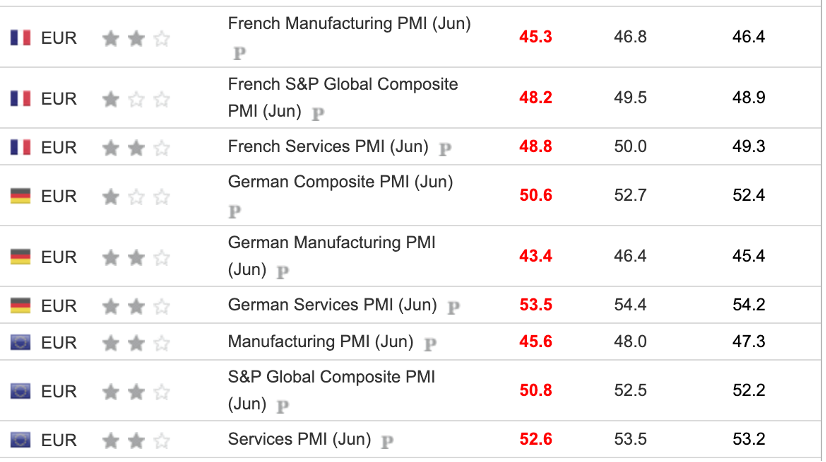
The latest round of monthly purchasing managers' surveys (PMI) on private sector activity published on Friday morning showed continued contraction in the manufacturing sector in most European countries. Whilst the services sector has performed better, the bulk of the readings came in lower than expected in June. This data puts a damper on the improving sentiment stemming from European data in recent months.
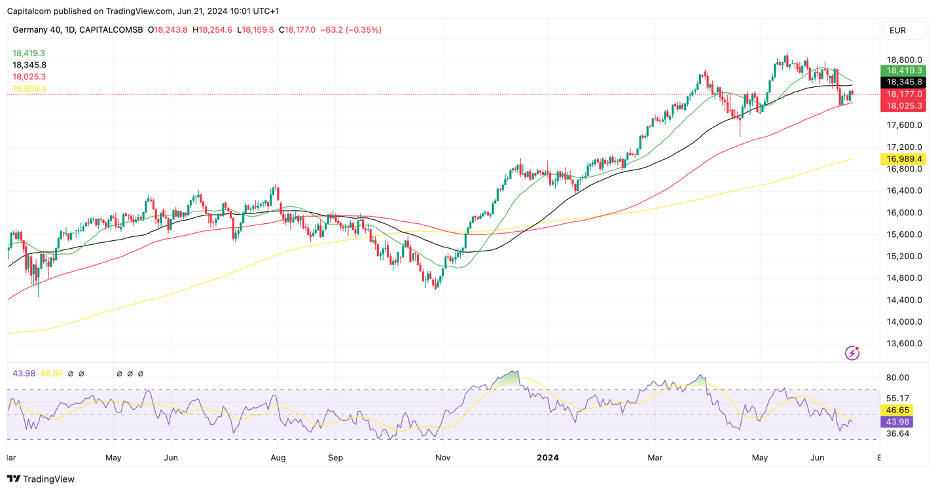
After Thursday’s bullish run, equities have turned bearish again on Friday. The weaker PMI data has likely weighed on sentiment, but we’re also likely seeing some technical correction underway. The DAX 40, for example, has been trailing along its key averages for a while. Before the pullback last week, the 50-day SMA (black line) was acting as a floor but once it was breached the 100-day SMA (red line) became the new key level of support, containing the losses for the past few days. It now seems like the price could be trapped between these two lines for the short term, suggesting the 50-day SMA could become the next level of resistance, currently at 18,345.
DAX 40 daily chart
Past performance is not a reliable indicator of future results.
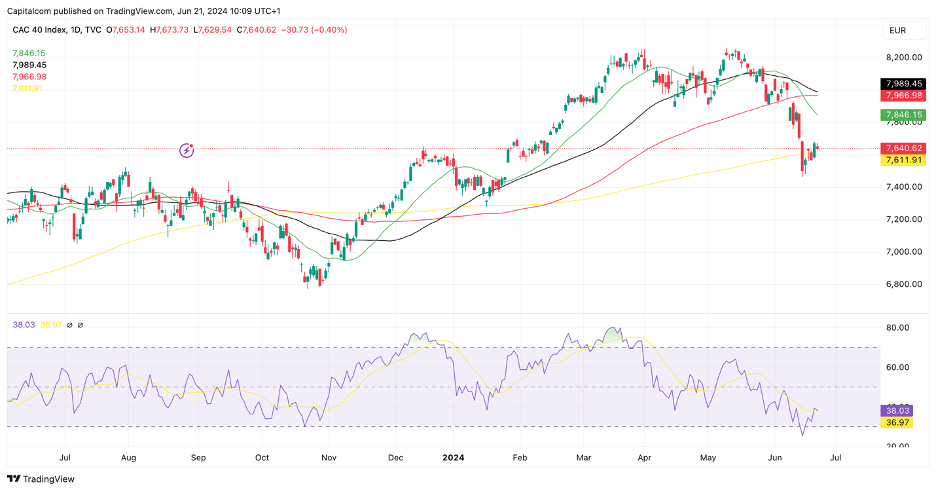
Elsewhere, the CAC 40 has managed to move above the 200-day SMA once again, but the path of least resistance remains slightly challenged. The momentum from the past few days shows a bullish bias in the short term, with higher lows alongside a rising RSI. But there seems to be a lack of commitment in the reversal and the fact that the bullish drive has only managed to recover one day’s worth of pullback in five days shows a weak outlook for the index.
CAC 40 daily chart
Past performance is not a reliable indicator of future results.
Disclaimer: This is for information and learning purposes only. The information provided does not constitute investment advice nor take into account the individual financial circumstances or objectives of any investor. Any information that may be provided relating to past performance is not a reliable indicator of future results or performance. Social media channels are not relevant for UK residents.
Spread bets and CFDs are complex instruments and come with a high risk of losing money rapidly due to leverage. 84.01% of retail investor accounts lose money when trading spread bets and CFDs with this provider. You should consider whether you understand how spread bets and CFDs work and whether you can afford to take the high risk of losing your money.
The information provided is not to be considered investment advice or investment research. Capital.com will not be liable for any losses from the use of the information provided.'
- English (USA)
- English (India)
- English (Canada)
- English (Australia)
- English (South Africa)
- English (Philippines)
- English (Nigeria)
- Deutsch
- Español (España)
- Español (México)
- Français
- Italiano
- Nederlands
- Português (Portugal)
- Polski
- Português (Brasil)
- Русский
- Türkçe
- العربية
- Ελληνικά
- Svenska
- Suomi
- עברית
- 日本語
- 한국어
- 简体中文
- 繁體中文
- Bahasa Indonesia
- Bahasa Melayu
- ไทย
- Tiếng Việt
- हिंदी
European equities recover but PMIs continue to show weakness
Published 21/06/2024, 10:18
European equities recover but PMIs continue to show weakness
Latest comments
Loading next article…
Install Our App
Risk Disclosure: Trading in financial instruments and/or cryptocurrencies involves high risks including the risk of losing some, or all, of your investment amount, and may not be suitable for all investors. Prices of cryptocurrencies are extremely volatile and may be affected by external factors such as financial, regulatory or political events. Trading on margin increases the financial risks.
Before deciding to trade in financial instrument or cryptocurrencies you should be fully informed of the risks and costs associated with trading the financial markets, carefully consider your investment objectives, level of experience, and risk appetite, and seek professional advice where needed.
Fusion Media would like to remind you that the data contained in this website is not necessarily real-time nor accurate. The data and prices on the website are not necessarily provided by any market or exchange, but may be provided by market makers, and so prices may not be accurate and may differ from the actual price at any given market, meaning prices are indicative and not appropriate for trading purposes. Fusion Media and any provider of the data contained in this website will not accept liability for any loss or damage as a result of your trading, or your reliance on the information contained within this website.
It is prohibited to use, store, reproduce, display, modify, transmit or distribute the data contained in this website without the explicit prior written permission of Fusion Media and/or the data provider. All intellectual property rights are reserved by the providers and/or the exchange providing the data contained in this website.
Fusion Media may be compensated by the advertisers that appear on the website, based on your interaction with the advertisements or advertisers.
© 2007-2024 - Fusion Media Limited. All Rights Reserved.
