Market Overview
It is hard to get away from the fact that newsflow on the US/China trade dispute on a near-daily basis gives traders cause for direction and varied levels of risk appetite. Mixed signals on almost a daily basis at the moment. The suggestion from Chinese state media (very much a mouthpiece for the government) over the weekend was that negotiations are “constructive”. However, this has been contradicted by a report yesterday, citing a Chinese government official who suggested that China is “pessimistic” over a deal due to Trump’s reluctance to reduce tariffs. The significance of this apparent contradiction is questionable, seeing as the source of Saturday’s optimism seems to be much higher ranking and the pessimism is unlikely to be a game-changer. What is not questionable though, is that it has had a significant impact across markets.
The dollar has just lost its way in recent days again as yields have fallen away, gold has rallied and the yen has strengthened. The dollar unwind is also not restricted to safe havens too, with the euro bouncing, whilst AUD is stable. This could all give another opportunity to play for what is still the likely move towards “phase one” being signed. If the Chinese yuan can strengthen the rate back under 7 again this would signal growing market confidence in an agreement. Clearly, though there is still some caution.
Wall Street closed a very tentative session with marginal gains with the S&P 500 +0.1% at 3122 with US futures again a tick or so higher by +0.1%. Asian markets were mixed overnight with the Nikkei -0.5% and Shanghai Composite +0.9%. European markets are continuing to look on the bright side, with FTSE Futures +0.3% whilst DAX Futures are +0.3%.
In forex the edging USD corrective slip continues, with very mild gains on EUR, GBP and JPY. The interesting mover is a mild decline on AUD after the minutes for the recent RBA meeting spoke of the potential need for further rate cuts.
In commodities, there is a consolidation on gold today whilst oil is slightly weaker again after yesterday’s drop back.
It is a quiet European morning for the economic calendar before focus turns to US housing data. US Building Permits at 13:30 GMT are expected to remain at 1.39m in October (1.39m in September) whilst US Housing Starts are expected to improve to 1.32m (up from 1.26m in September).
There is also another Fed speaker to keep an eye out for, with John Williams (voter, mild dove) speaking at 14:00 GMT.
Chart of the Day – Silver
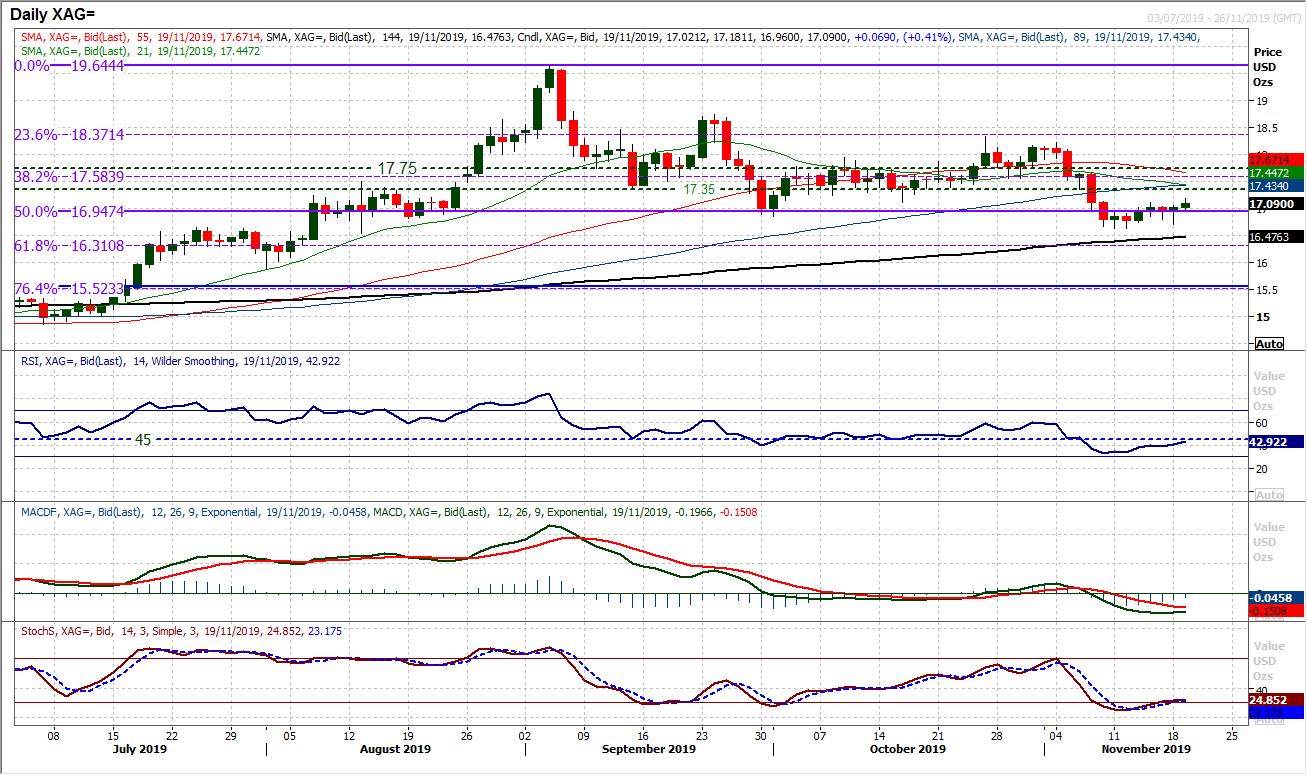
The downside break below the old key October low at $16.85 just over a week ago was seen as a key move. A move that confirmed the continuation of lower highs and lower lows of recent months, was backed also by a similar breakdown on momentum (RSI below 40 and MACD lines for six month lows). However, key breakdowns will often see retracement moves that give a better chance to sell. We see last week’s rebound from $16.63 has been a struggle and suggests that there are sellers ready to pounce. There is a band of resistance $17.12/$17.35 of overhead supply which is that opportunity. Selling pressure has started to leak back in again until yesterday’s intraday rally (on China newsflow again). However, we see this as short-lived . The move is just unwinding RSI back into the 45/50 area which helps to renew downside potential. We are looking for the rally to struggle around $17.12/$17.35. The Fibonacci retracements of $14.25/$19.64 have been key consolidation and turning points for the past few months, meaning that the 38.2% Fib around $17.40 is a key barrier. We see rallies increasingly as a chance to sell for a continued correction.
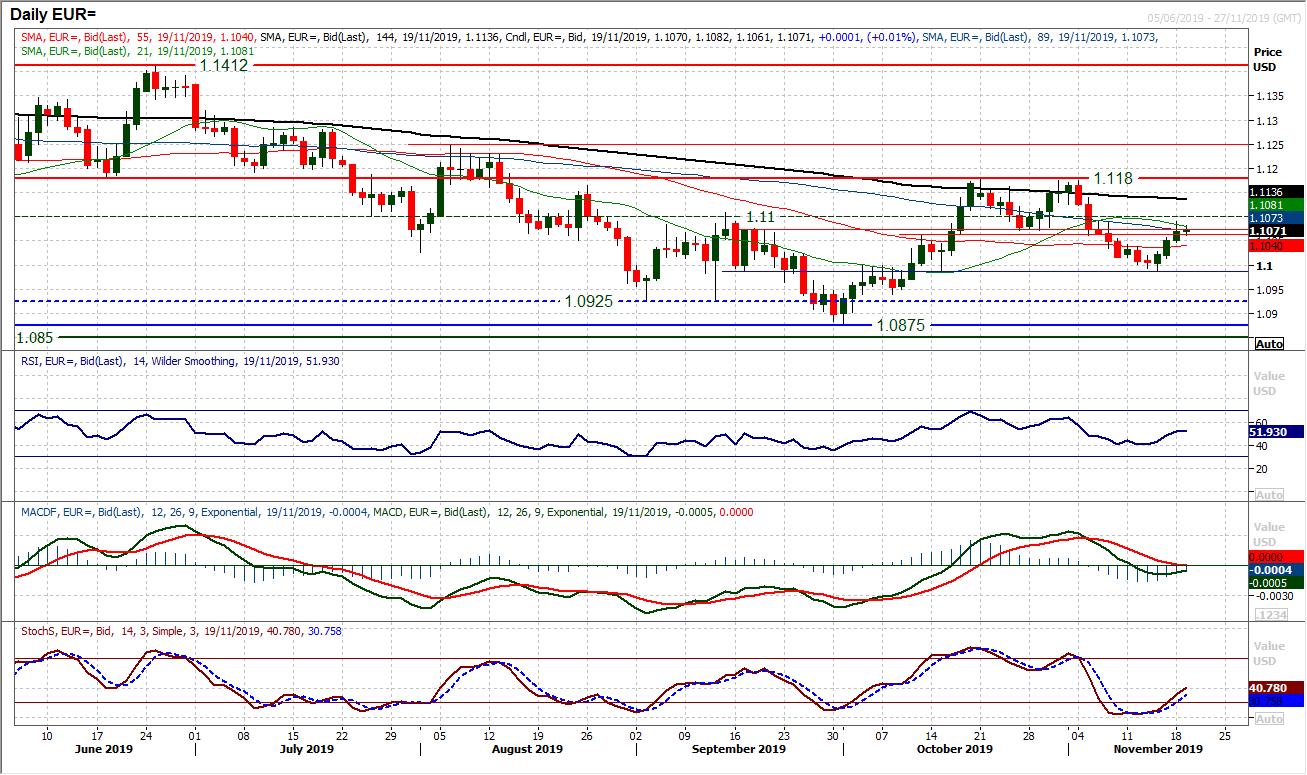
Another swing back higher for the euro has now formed three consecutive positive candles and see the recovery pick up to bolster the support around $1.0990. The market is now pushing through the old pivot band which had been resistance $1.1060/$1.1075. With RSI up from 40 and MACD lines stabilising around neutral, this helps to build a more neutral outlook on EUR/USD. The bulls will be looking to push back above $1.1100 but there is considerable resistance at $1.1180 which we see as a key barrier now as the market develops into what we see now as an oscillating range. Closing above $1.1075 helps to improve the outlook slightly whilst maintaining the hourly RSI above 50 and hourly MACD above neutral also lends a near term positive bias.
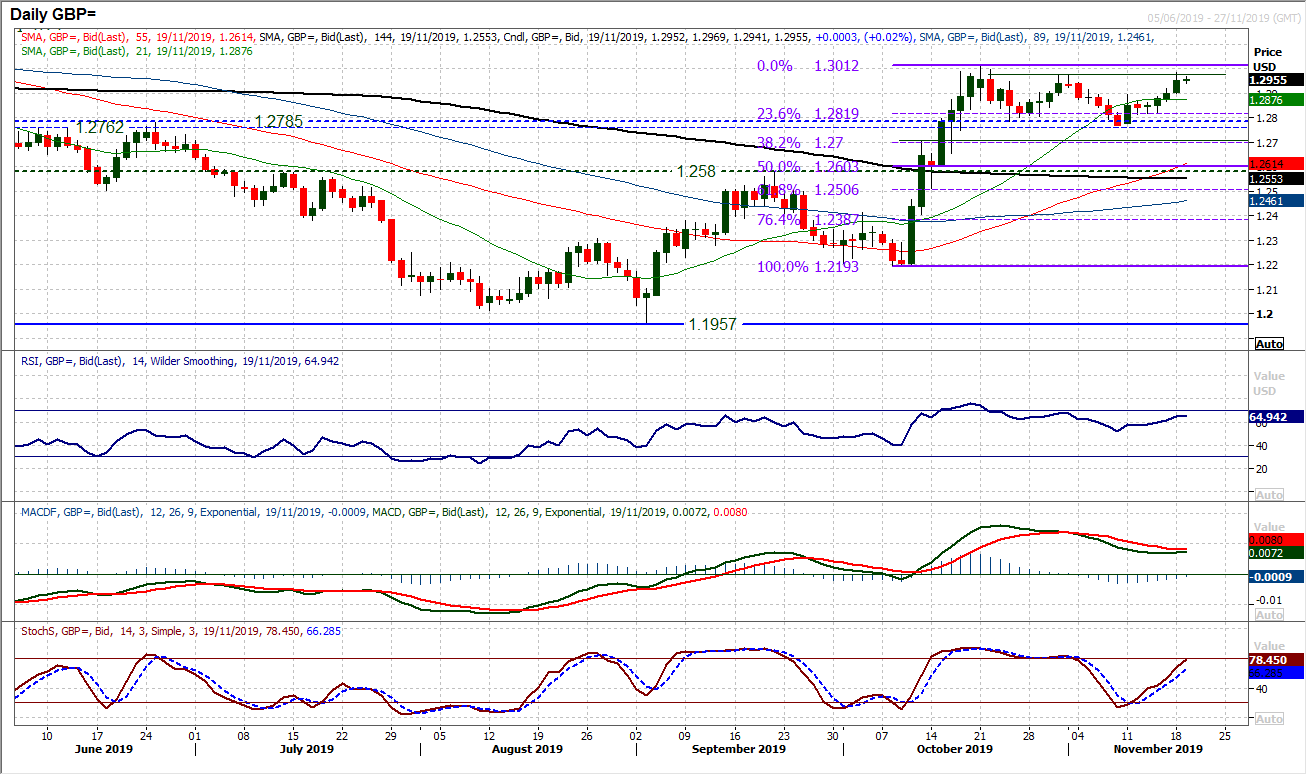
Getting a handle on the outlook and swings in the UK General Election campaign is crucial for the near term outlook on Cable. Technically this is a market in a range now. Another swing back higher is testing the resistance band $1.2975/$1.3010 but this is a move higher that we do not see is likely to last. The near term outlook is positive though, with the hourly chart showing a base of support forming above $1.2900 and testing higher with positive configuration on momentum. This is reflected in the positive configuration on momentum too. Yesterday’s high at $1.2985 was an initial test of the $1.2975/$1.3010 resistance of the October highs. A live tv debate (the first) between the two leading candidates in the UK election today could lend some added volatility this evening. A closing breakout above $1.3010 would come with a suggestion of sustainable Conservative lead.
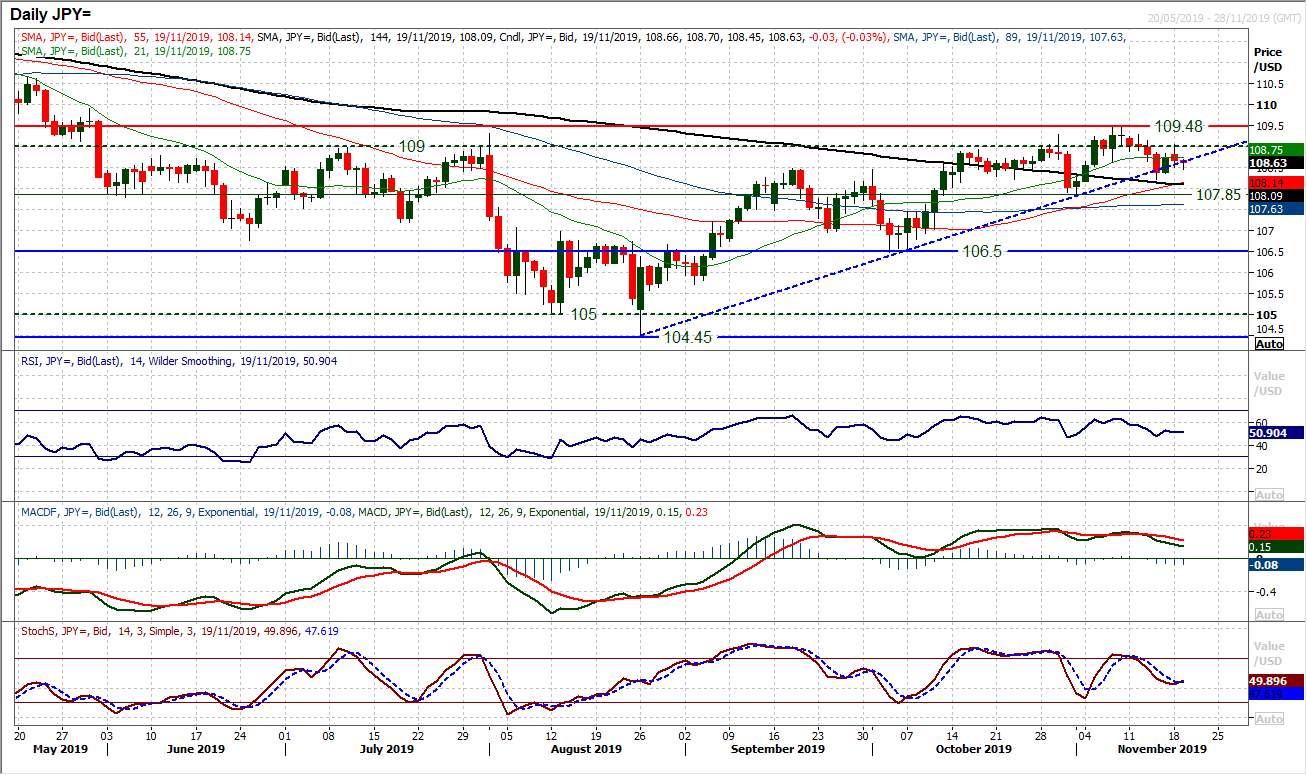
A positive response to an uptrend breach looked to be the bulls fighting back, however, Dollar/Yen is still a market at a key inflection point. Yesterday’s failure at 109.00 adds to the concern that 109.00/1009.50 is resistance that the market cannot overcome. Given the market struggled for about a week to break free only to leave resistance at 109.50 this means that the resistance band 109.00/109.50 is now a crucial barrier for the bulls. Momentum indicators retain their mild positive medium-term bias, but also reflect the lack of conviction in the near term outlook. With the recent breach of the 11 week uptrend, another negative candle today and breach of the old trend would really suggest that this is turning into a medium-term range. So it means that the reaction for the coming days is key. The hourly chart shows resistance at 109.30/109.50 with support at 108.2 as a key level now.
Gold
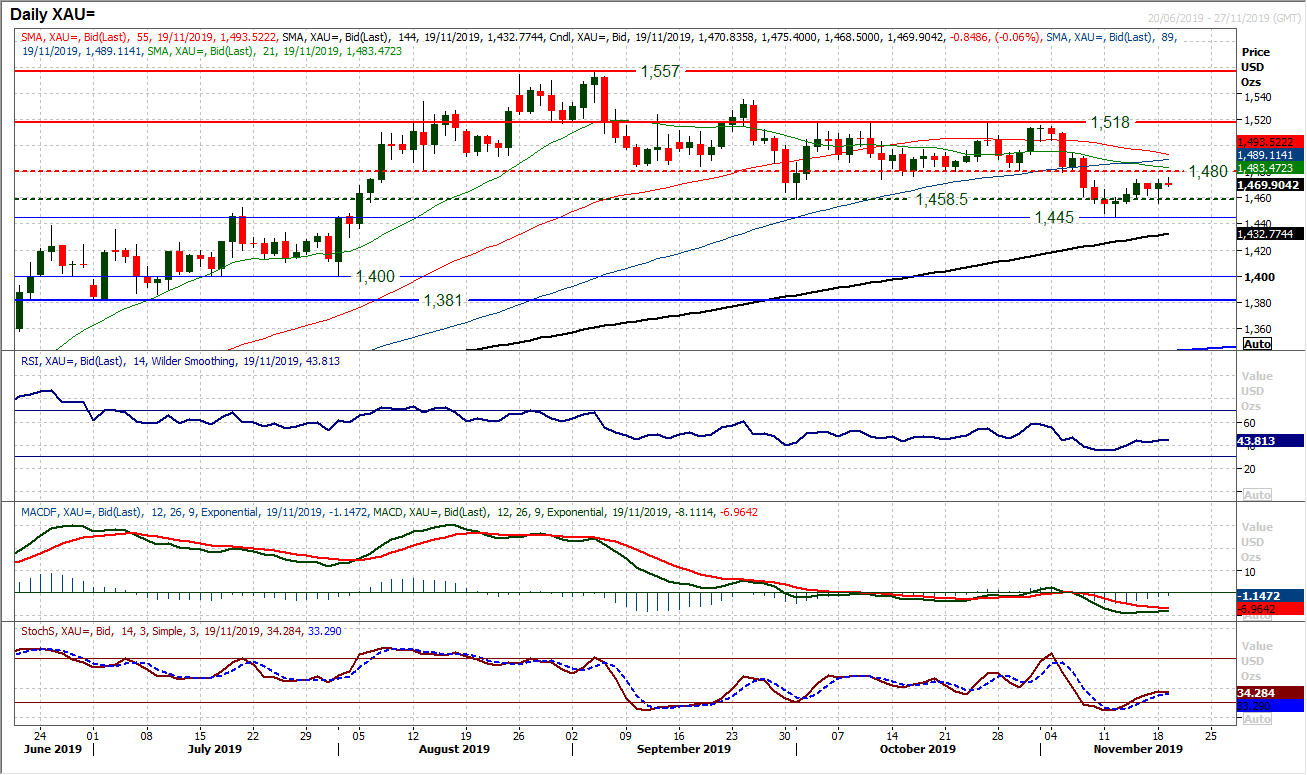
Following the downside break of $1458 key October low, gold has engaged in a mild unwinding drift back higher. We continue to see this move will be the source of the next chance to sell. There is resistance of overhead supply $1474/$1480 which is now being tested. Another failure around here could be the trigger signal. The RSI failing around 45/50 would be a negative signal now and already the Stochastics are looking tired in a rebound. The hourly chart shows a recovery has lost some of its impetus now and more neutral set up is beginning to develop across momentum indicators. Initial support of yesterday’s low at $1456 now protects $1445. The bulls need a decisive pop above $1494 to really suggest a sustaining recovery.
WTI Oil
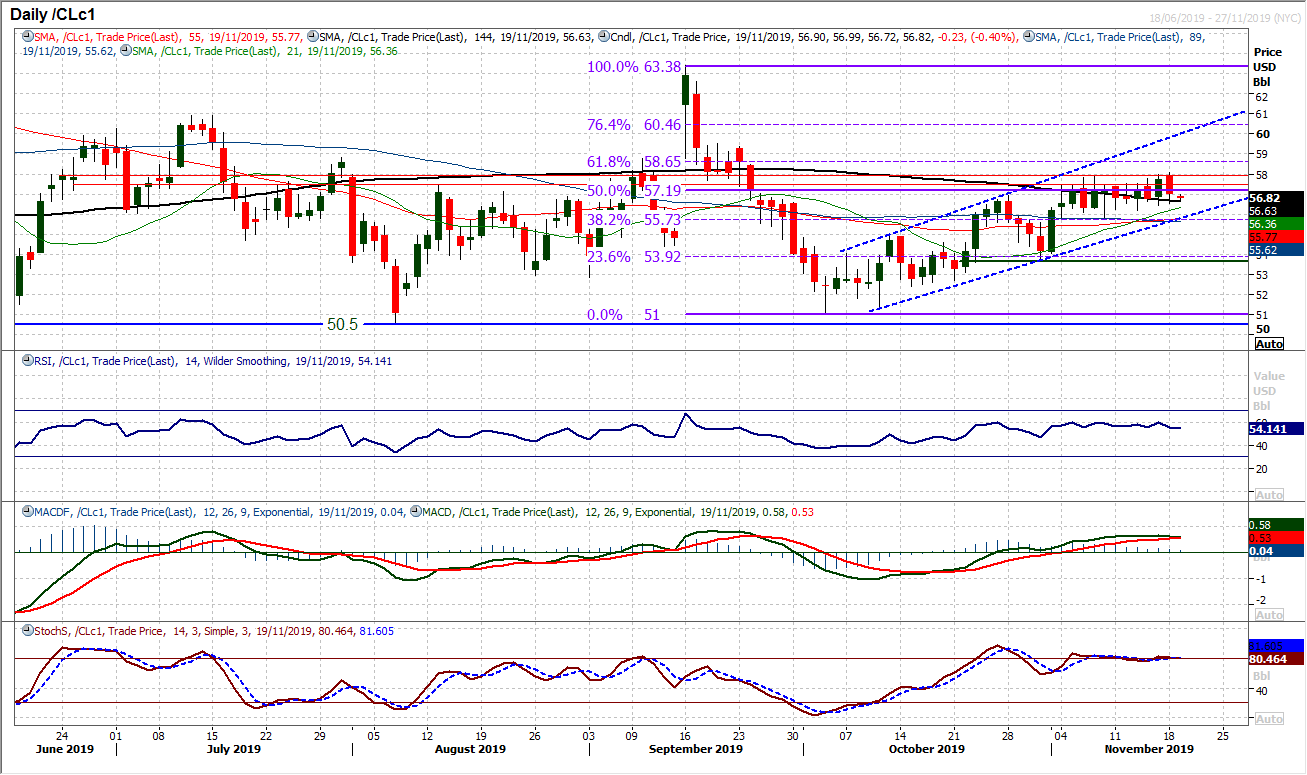
Whilst we continue to play the uptrend channel, it is still a real struggle for the bulls to get away. The candles of recent sessions reflect this. Resistance has continually been formed between $57.45/$57.90 over the past couple of weeks. An intraday breach in yesterday’s session hints at further gains for the bulls, but a subsequent unwind to close lower (with a negative candle) reflects the lack of decisive control. However, we still see weakness as a chance to buy, as the channel continues to build higher lows and higher highs. The RSI reflects a positive bias but needs to move into the 60s consistently to allow the bulls to generate more confidence. The 38.2% Fib (of $63.40/$51.00) is now a key basis of support at $55.75 with a support band at $55.75/$56.20 increasingly important and channel support at $55.80. We are looking for further hard fought gains to retest $58.10 (yesterday’s high) and then on towards $59.40.
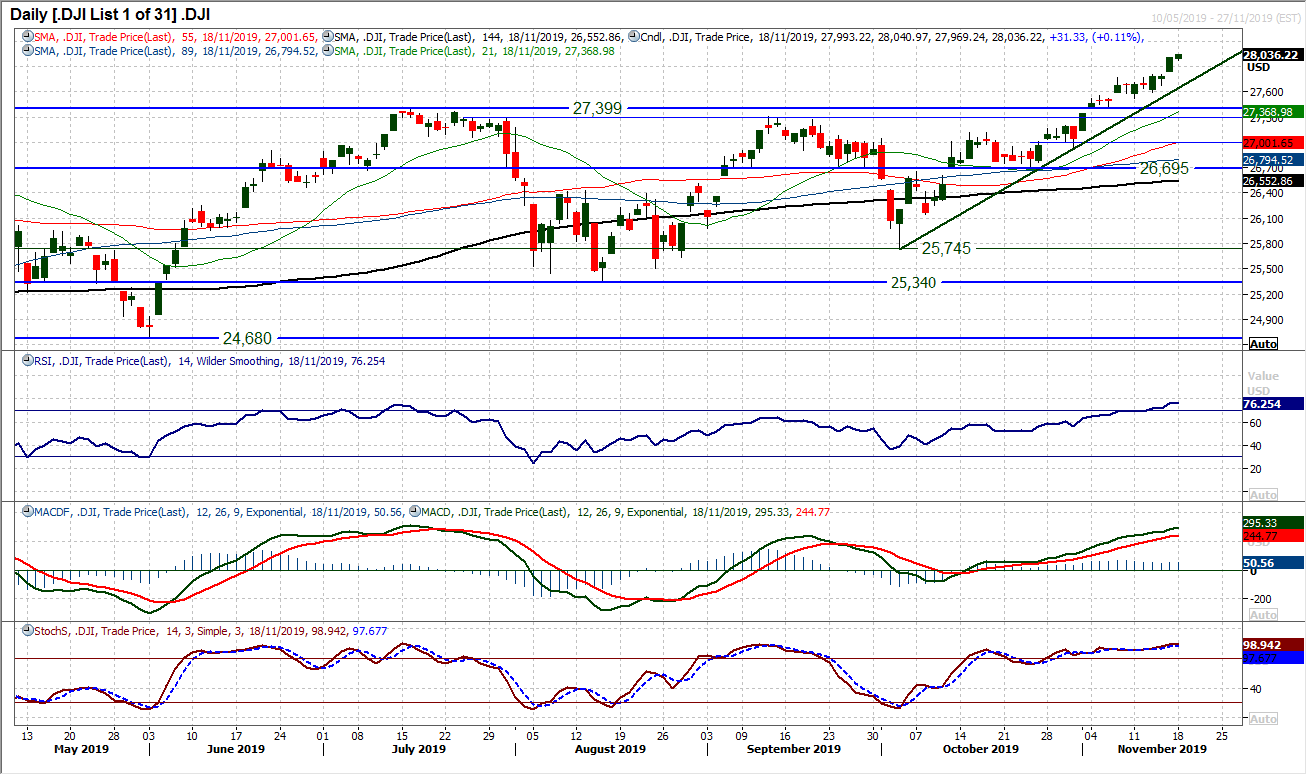
The bulls seem to be on a relentless run at the moment. Another positive session (albeit with a small daily range) and another all-time closing high. It is difficult to bat against the huge rally which every time it shows signs of running out of steam, just finds another gear from somewhere. Back in January 2018 the RSI spent over two weeks in the 80s, so when the Dow trends, you had better not be caught on the wrong side. Equally though, when that January 2018 trend hit the wall, it created a huge correction. So cautious longs would be wise. The hourly chart shows strength of momentum but a little stretched near term which could lend some consolidation. Initial support around 27,775/27,800.
DISCLAIMER: This report does not constitute personal investment advice, nor does it take into account the individual financial circumstances or objectives of the clients who receive it. All information and research produced by Hantec Markets is intended to be general in nature; it does not constitute a recommendation or offer for the purchase or sale of any financial instrument, nor should it be construed as such.
All of the views or suggestions within this report are those solely and exclusively of the author, and accurately reflect his personal views about any and all of the subject instruments and are presented to the best of the author’s knowledge. Any person relying on this report to undertake trading does so entirely at his/her own risk and Hantec Markets does not accept any liability.
