Market Overview
Geopolitical tensions between the US and Iran in the Middle East may remain elevated, but they have also not escalated further early this week. The threat of some sort of reprisal attack by Iran (either direct or indirect) is still likely, but with nothing immediately coming, markets are beginning to find the dust settling.
Whilst some key markets have become stretched (such as oil and gold), leading to the potential for retracements, for now, the added risk premium that has taken flow into safe havens, is still required. It will remain so whilst uncertainty remains of how a response by Iran will take shape. Despite this though, there is a degree of bounce back today.
Treasury yields rebounded into the close last night, whilst equity markets are taking a lead on this to drive a recover today. However, there is still a questioning of the rebound this morning, as forex majors reflect a risk retreat again and Treasury yields slip back. Can this apparent contradiction continue? Something will need to give. Attention will also turn back to the PMIs once more, with the US ISM Non-Manufacturing in focus today.
Wall Street rebounded into the close last night with the S&P 500 +0.4% higher at 3246. With US futures also higher today +0.1% this has helped a broad bounce in Asia (Nikkei +1.6%, Shanghai Composite +0.7%). Markets in Europe are set to follow this rebound, with the FTSE Futures +0.5% and DAX Futures +0.6% higher in early moves. However, in forex there is a move back into safety, with JPY performing well, along with USD. On the flipside, AUD and NZD are suffering, whilst EUR is also dropping back slightly.
In commodities, as the European session has got going, there has been a move back into gold again after yesterday’s late slip, however, oil is over -0.5% lower today.
The outlook of the US services sector will be key on the economic calendar today, along with the first look at Eurozone inflation. Flash Eurozone HICP for December is at 10:00 GMT with headline inflation expected to increase to +1.3% (from +1.0% in November) and core inflation staying at +1.3% (+1.3% in November).
US Trade Balance for November is at 13:30 GMT with an improvement in the deficit to -$43.8bn (from -$47.2bn in October).
The US ISM Non-Manufacturing is at 15:00 GMT and is expected to improve to 54.5 (from 53.9 in November) and will be particularly watched after the manufacturing disappointment last week. US Factory Orders for November are at 15:00 GMT with the notoriously volatile data expected to fall by -0.8% on the month (+0.3% in October).
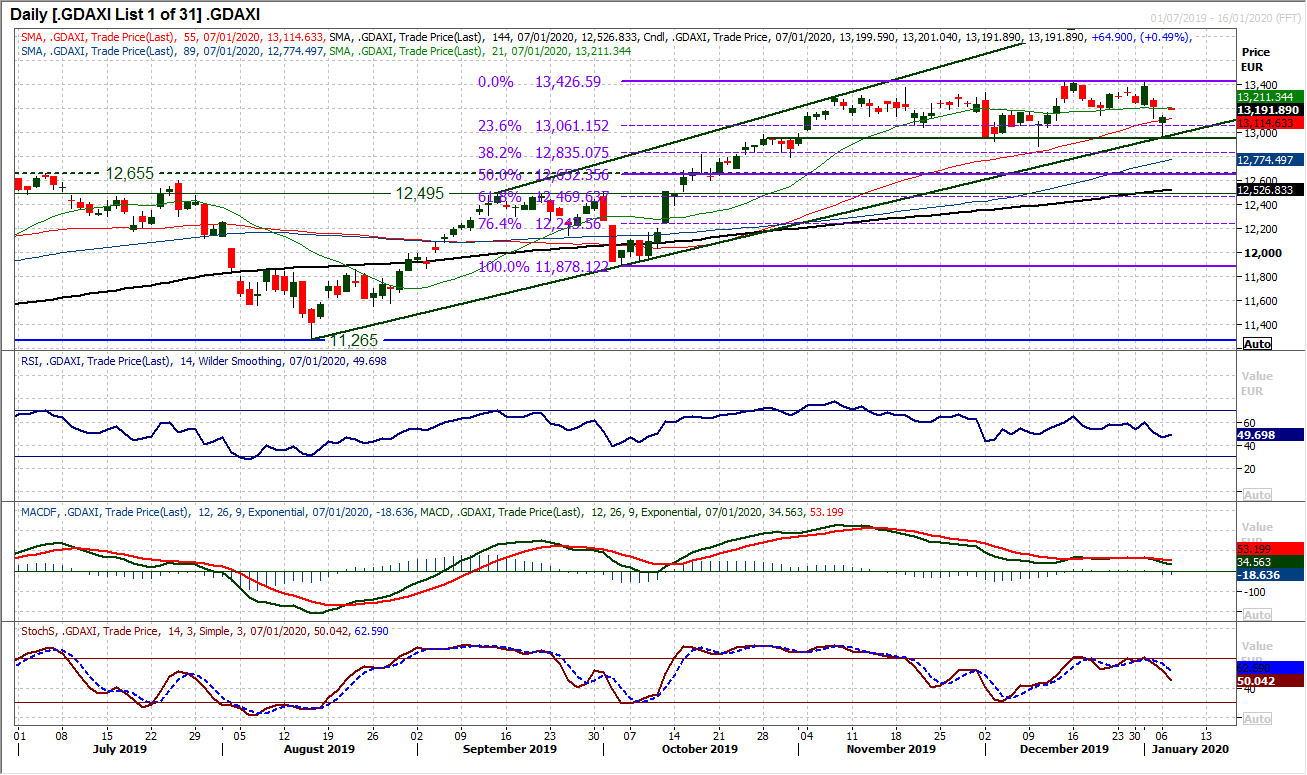
Chart of the Day – German DAX
The bullish outlook for the DAX has been rocked in recent sessions as risk appetite has been hit from a rise in geopolitical risk. However it interesting to see yesterday’s rebound off 12,948 as a near five month uptrend provided the basis of support. This rebound also came effectively off the bottom of what seems to be a two month trading range broadly between 12,950/13,425. The bulls will certainly point to the fact that the opening gap below 13,120 has been bull closed. This closing of the gap also meant that the market formed a bull hammer candlestick yesterday. This was a hugely positive reaction meaning that the market closed +178 ticks from the low. Momentum indicators have reacted in the past couple of days but are still positive within their medium term configuration. The RSI has been above 40 throughout the five month channel, whilst MACD lines remain above neutral and Stochastics have only marginally slipped. Once more holding above the 23.6% Fib retracement (of 11,878/13,425) at 13,060 leaves the bulls in the box seat still. Weakness remains a chance to buy whilst these positive indicators continue. The hourly chart shows resistance at 13,140 and then 13,245.
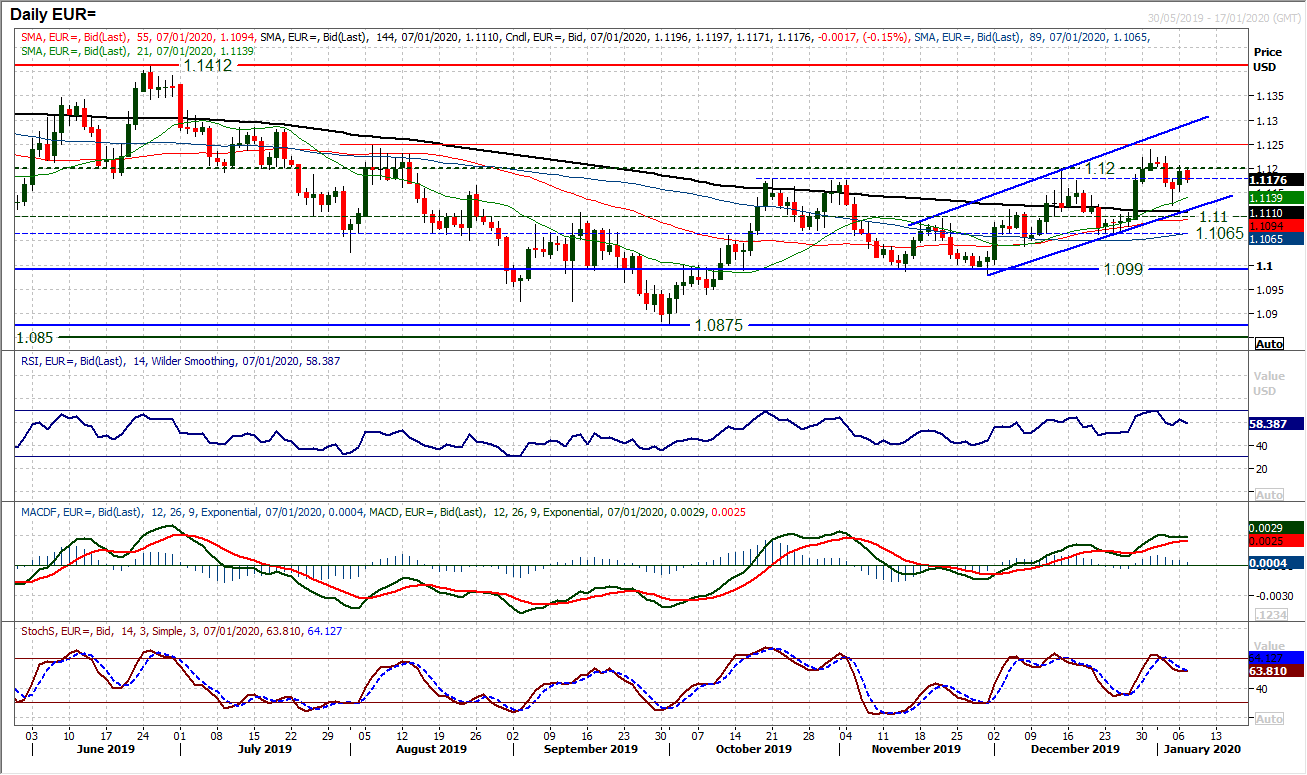
An impressive rebound of strength on the euro yesterday has bolstered the support around the lows of the uptrend channel and continues to suggest that corrections will be supported. There is an ongoing positive configuration throughout momentum indicators, with the RSI holding above 50/60, the MACD lines advancing above neutral and Stochastics again moderating their swing lower in a position above 50. The test is now the resistance band $1.1180/$1.1200 which needs to be overcome today. The hourly chart shows support is building at higher levels again in recent days, at $1.1150 above $1.1125, whilst latterly a pivot around $1.1180 is holding this morning. A close above $1.1200 would be a move clear of the old key resistance and open $1.1240 once more to continue the channel higher. The market is still tracking the rising 21 day moving average (today at $1.1140) as a basis of support since December.
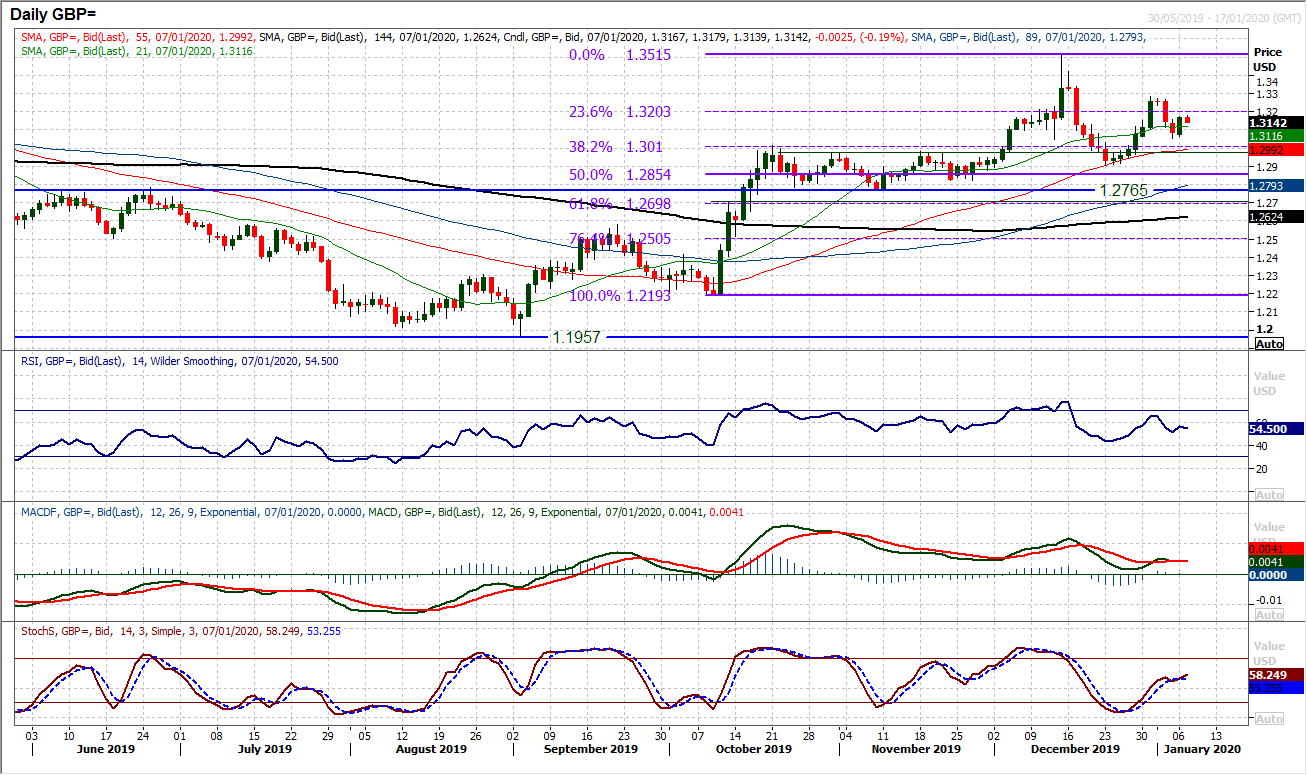
The near term outlook has taken on an increasingly uncertain configuration in recent sessions. However, taking a step back and we continue to view support around $1.2900/$1.3000 on a medium term basis as a buying opportunity. Ongoing positive configuration on momentum (RSI above 40, MACD lines above neutral, Stochastics rising above 50) suggests that corrections remain a chance to buy. Yesterday’s reaction only adds to that view, with a decisive positive candle forming to leave support around $1.3050. However, looking on the hourly chart there is a lack of conviction, as the hourly RSI oscillates between 30/70 (turning back from 70 again) whilst the MACD and Stochastics lines both post bear crosses. It suggests a lack of traction follow through from yesterday’s rebound. Above initial resistance at $1.3180 would test the 23.6% Fibonacci retracement (of $1.2192/$1.3515) around $1.3200, but the key near term resistance is at $1.3285.
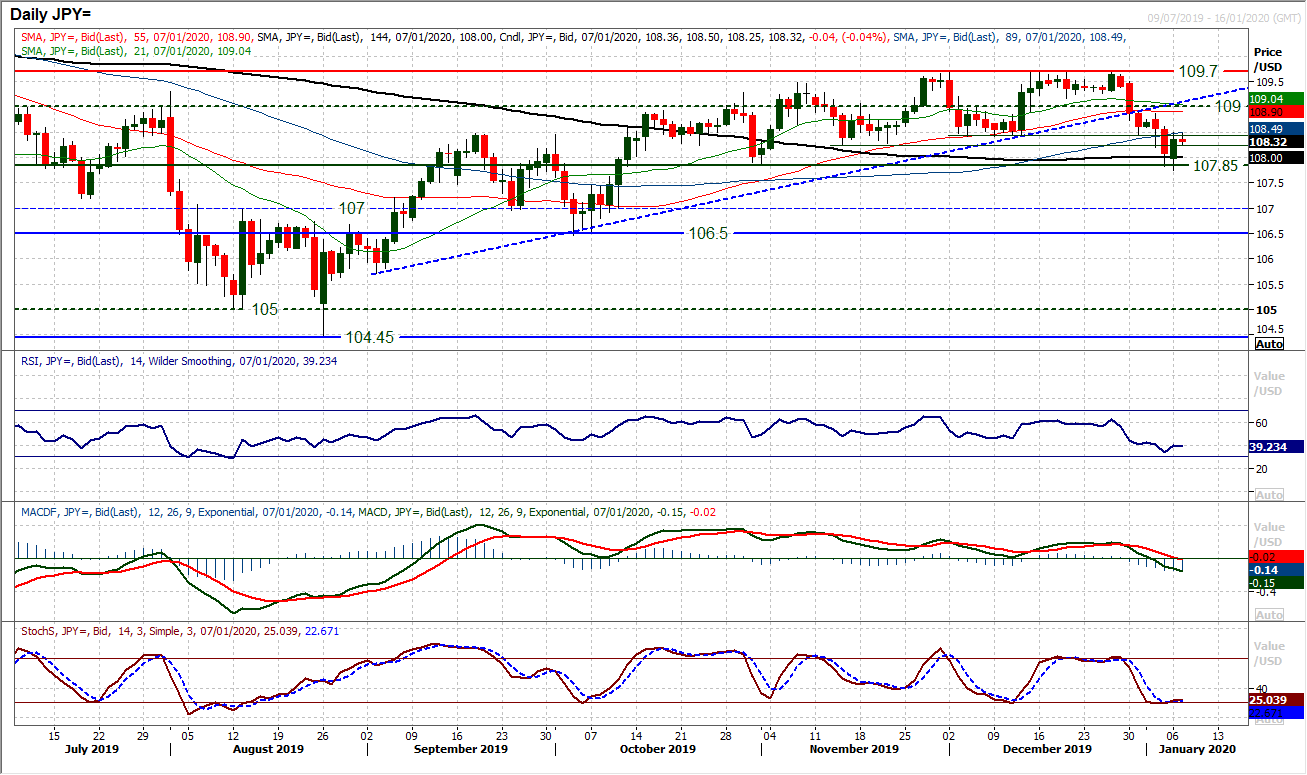
After an initial test of the support around 107.85 yesterday, the bulls responded well in the latter half of the session to form a strong positive candlestick. A rebound has taken the market back into the overhead supply band of 108.40/108.50. Given the magnitude of yesterday’s candle (+37 pips on the day), the reaction during today’s session will be very interesting. We have seen a marked deterioration in the medium term outlook on RSI (decisively below 40) and MACD lines (below neutral). It now suggests that this is now likely to be a medium term range between 107.85/109.70. However, if this rebound fails quickly to find a lower high under the first reaction high 108.85 (which is now under the old pivot of 109.00) then the selling pressure could ramp up once more. Closing back under the resistance band 108.40/108.50 would be disappointing. The bulls need a move back above 109.00 to really begin to feel more secure within this range.
Gold
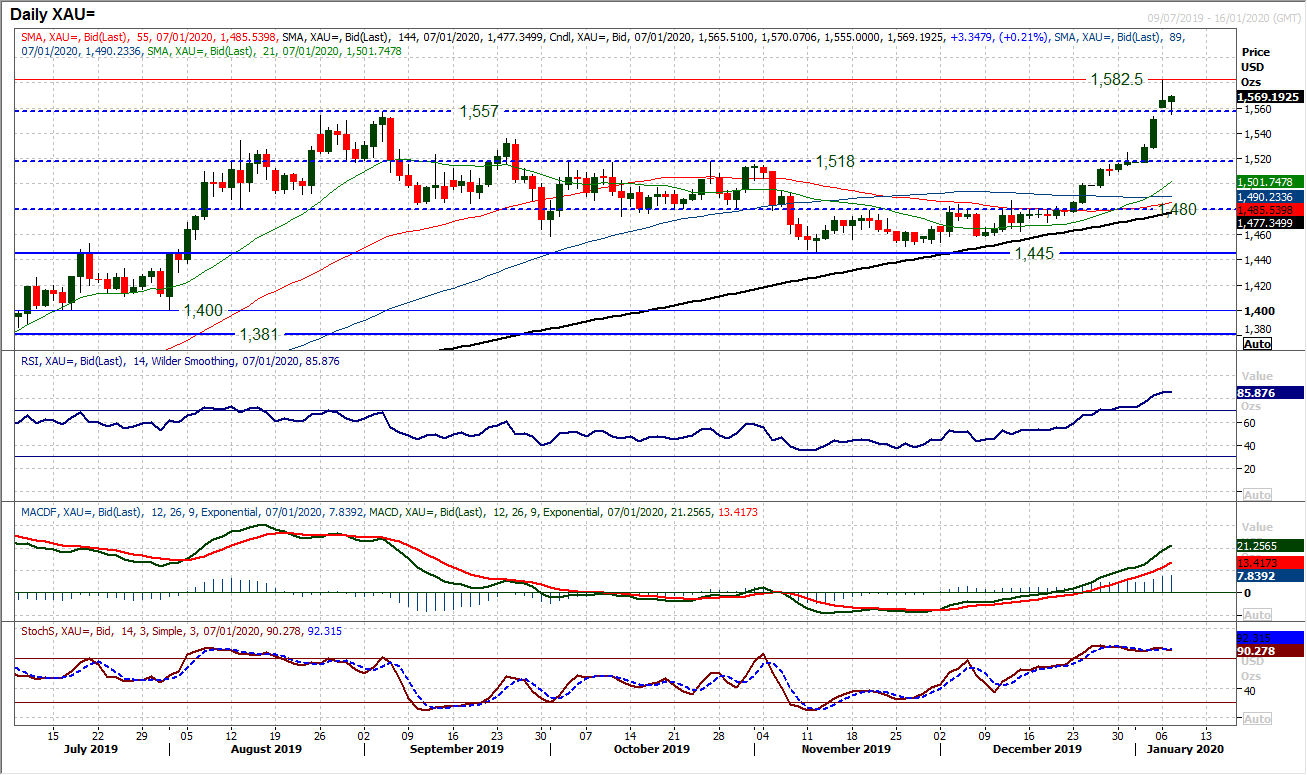
We were turning more cautious on the gold bull run yesterday as technical studies (RSI and Bollinger Bands) point to overstretched conditions. The reaction into the close yesterday poses a lot of questions now. Losing -$15 from the day high of $1580 the market has formed a highly questionable positive close. A small positive candlestick body after a failed run higher leaves the market in a tricky position. There is a gap still open at $1553 which needs to be filled, but a closing of the gap could trigger some deeper retracement of the bull run. Today’s early move hints of consolidation. After such a strong run higher, the market is unlikely to now simply hover. A loss of traction significantly increases the potential for a profit-taking near term corrective move. The hourly chart shows the 21 hour moving average now taking on a basis of support (currently around $1559). The bulls need to continue their run higher to prevent a slide back. Given the initial bounce off $1555 this morning, a failure under a near term pivot at $1570 followed by a breach of $1555 would be a negative signal. A close under $1553 opens $1540.
WTI Oil
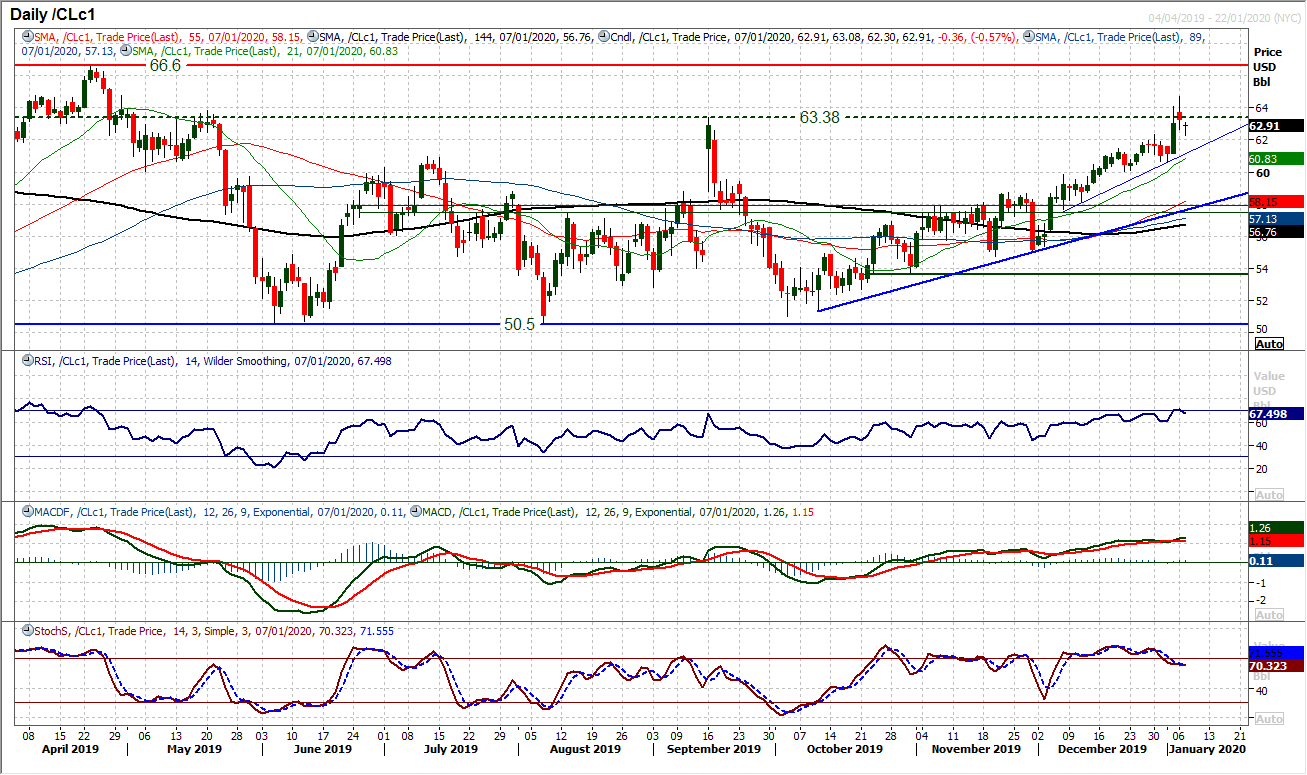
Volatility on oil is still elevated, however, with no immediate escalation in geopolitical tensions in the Middle East, the immediate upside on oil has just moderated slightly. Yesterday’s close was higher (following an initial gap higher) but a negative candle formed on a close below the open. This has been followed by an opening gap lower today (opening the prospect of an “evening star” candlestick formation, which would need a strong bear candle today to complete). The RSI pulling back from 70 and near term slip in Stochastics adds to the potential for a near term retracement in the December bull run. Focus comes with the initial support at $62.35 with the more considerable $60/$60.65 support area underneath. However, what could underpin the market at elevated levels could be the uncertain geopolitical climate and markets maintaining that degree of risk premium. Closing above $63.40 would be a positive signal now.
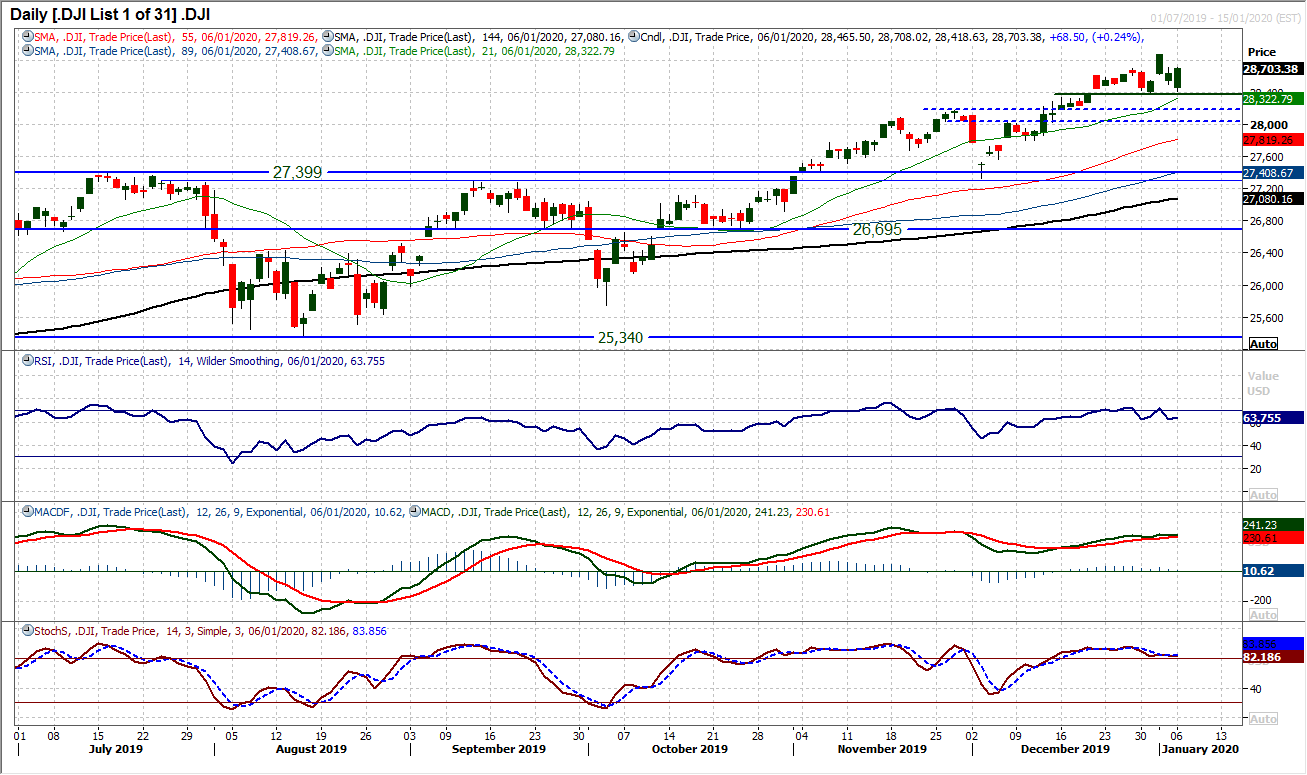
Concern for bull markets increases when good news is sold into. When bad news is bought into, then it shows that the bulls are still in a strong position. In both sessions since the geopolitical tensions hotted up on Friday, we have seen a positive reaction from the bulls. Yesterday’s initial decline was bought solidly throughout the session to leave a strong positive candlestick and the bulls still very much in control. The first reaction low at 28,376 is still intact as support and will now take on added importance. The way the market is shaping over the past couple of weeks, should 28,376 support fail, it would complete a top pattern. However, with futures pointing to a marginally positive open, the bulls are looking higher. Momentum indicators remain positively configured, with RSI still above 60 (below 60 would hint at completion of the small top), whilst MACD and Stochastics are also positively configured. The all-time high of 28,873 is once more in focus.
DISCLAIMER: This report does not constitute personal investment advice, nor does it take into account the individual financial circumstances or objectives of the clients who receive it. All information and research produced by Hantec Markets is intended to be general in nature; it does not constitute a recommendation or offer for the purchase or sale of any financial instrument, nor should it be construed as such.
All of the views or suggestions within this report are those solely and exclusively of the author, and accurately reflect his personal views about any and all of the subject instruments and are presented to the best of the author’s knowledge. Any person relying on this report to undertake trading does so entirely at his/her own risk and Hantec Markets does not accept any liability.
