

Diversified and differentiated
CREI provides investors with diversified UK commercial property exposure, within a closed-end fund structure. It is differentiated by an enhanced income strategy that targets smaller, regional properties, with strong income characteristics, let to predominantly institutional grade tenants. Smaller properties provide a yield premium over larger assets, partly the result of a broader range of potential occupiers and less competition from larger institutional investors. Income risk is spread across a wide number of properties and tenants, the vast majority of which are externally classified as having better than average risk. Although diversified, the portfolio is not passively positioned and is actively managed. The weighting towards industrial and retail warehouse assets is strong. Meanwhile, accretive capital recycling has supported debt repayment and capex aimed at enhancing asset quality, rents and capital values, with a targeted yield on cost of at least 7%.
Focused on realising organic potential
FY24 earnings were supported by strong leasing, with increased occupancy and rents continuing to grow. Property valuations were modestly (4%) lower for the year but stabilised in Q4, as did unaudited NAV per share. A special dividend of 0.3p per share was paid, in addition to aggregate quarterly DPS of 5.5p, and the FY25 annual DPS target was increased by 9% to 6.0p, fully covered by EPRA earnings. There is little change to our forecasts. While the focus of the company is on realising the growth potential from the existing portfolio, reflected in reversionary rent potential of c £6m, or 15% of current rents, it recognises the potential for sector consolidation to generate economies of scale and further enhance diversification. CREI was disappointed that its proposed merger with API, supported by both boards, was unsuccessful, and we expect it to remain open to further opportunities.
Valuation: Fully covered 7.8% yield
The FY25 DPS target of 6.0p represents an attractive yield of 7.8%, while the discount to NAV is 18%, both broadly in line with peers. The valuation is close to a 10-year low and CREI’s premium rating versus peers has eroded.
Investment summary
This outlook note focuses on CREI’s long-term performance and strategy for continued growth in earnings and fully covered dividends. It also includes a review of the detailed FY24 financial report and an update on our forecasts. In summary, the investment case for the company is as follows:
- CREI is focused on enhanced income-driven returns, a more consistent component of total property returns compared with more volatile capital values.
- It provides diversified exposure to UK commercial real estate, enabling it to spread risks, adapt its portfolio to changing market and economic conditions and seek investment opportunities across a wide pool of assets.
- A focus on properties with smaller individual values differentiates it from most of its peers. Properties of this size typically provide a yield premium over larger assets, in part the result of a broader range of potential occupiers, while attracting less competition from larger institutional investors.
- The company has successfully managed the complexities of a smaller lot-size portfolio through asset and tenant selection and active asset management, and has generated a well-established track record of income-driven returns.
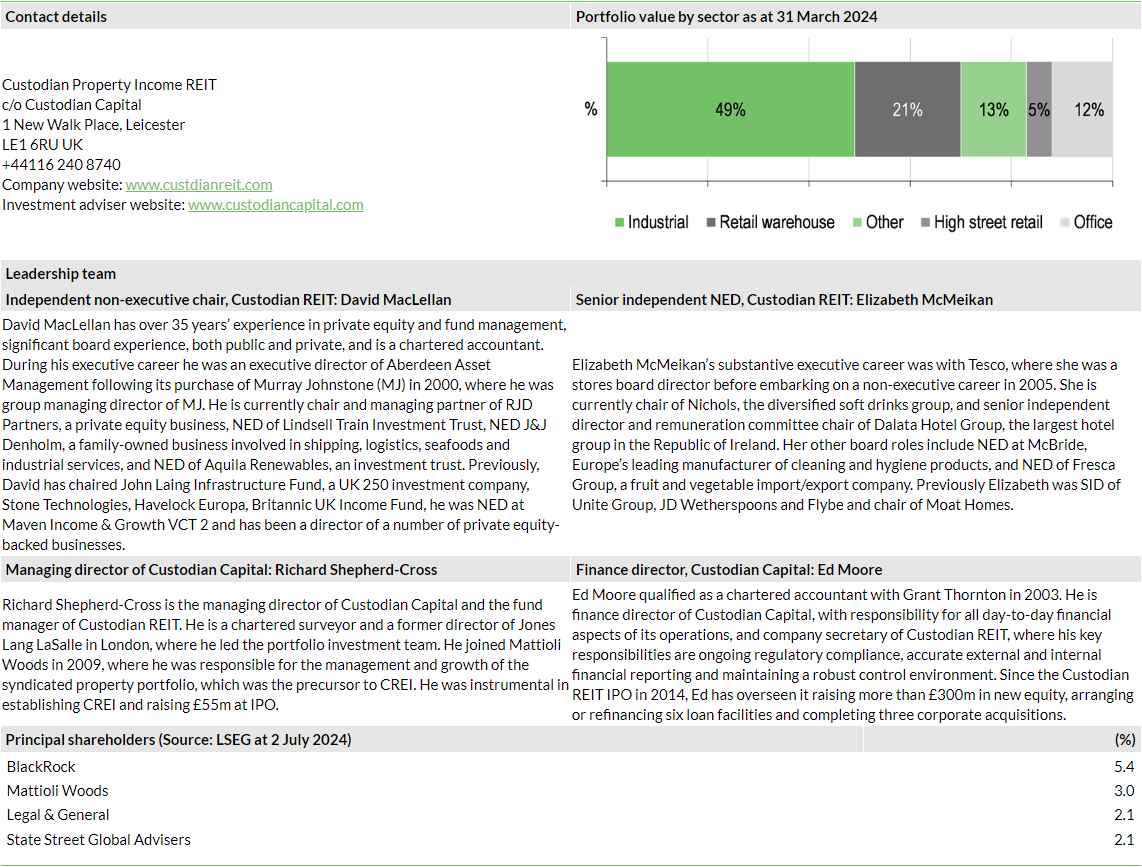
- The portfolio is strongly weighted towards the industrial (50% by value) and retail warehouse (21%) sectors, supported by strong fundamentals.
- Occupier demand generally remains robust, rents are continuing to increase and there is significant reversionary potential embedded in the portfolio.
- Gearing is moderate (after recent disposals, the current LTV is c 28%) and 78% of drawn debt is long term and fixed rate, providing earnings protection against increasing interest rates.
- Commercial real estate has traditionally provided a medium-term hedge against inflation as, at least in part, this is reflected in rental growth and valuations over time. Increasing building costs tend to restrict new construction.
- The most recent Investment Property Forum quarterly survey shows a consensus expectation of positive total returns across all sectors, averaging 7.5% pa from 2024–28, led by industrial and retail warehouse.
Committed to growth and open to consolidation
CREI has long sought to appeal to a broad base of institutional and private shareholders by providing a diversified and differentiated portfolio, with a strong income focus and low-risk balance sheet. This strategy is especially suited to investors unable or disinclined to choose between the broad range of single-sector, and in many cases higher-risk, funds.
The choice of sector-diversified commercial property real estate investment trusts (REITS), and the list of peers that we show in the valuation section of this note, has reduced drastically in the past three years, as a result of merger and acquisition activity and corporate wind-downs. The catalyst for this has been a challenging market environment since interest rates began to increase, leading to most companies trading at persistent discounts to NAV.
CREI recognises the merits of consolidation as a route to accelerating growth, increasing scale and liquidity while reducing cost ratios, and was disappointed that its proposed merger with abrdn Property Income Trust (API), agreed by both boards, failed to win sufficient shareholder backing by a very narrow margin. The merger would have created a larger, stronger, diversified REIT but API is now pursuing a strategy of managed wind-down.
Alongside the benefits of increased scale, several recent transactions have been driven by acquirers seeking to expand their presence in the industrial and logistics sectors, where structural demand factors and limited supply continue to drive above-average rental growth and capital value performance, areas in which CREI’s portfolio is well represented.
This was the motivation behind Urban Logistics’ (SHED’s) indicative proposal to API, rejected by the board, during the merger discussions with CREI. Similarly, subsequent to the discontinuation of discussions with Picton Property Income (PCTN), UK Commercial Property REIT (UKCM) was acquired by Tritax Big Box (BBOX). CT Property Trust (UKCPT) had earlier been acquired by LondonMetric (LON:LMPL) (LMP). In both cases the buyers were also particularly attracted by the opportunity to increase their industrial logistics exposure.
Consistent fully covered dividend returns
CREI’s income-focused strategy has generated positive income returns, from fully covered dividends, each year since listing in March 2014. Without assuming reinvestment of dividends, the aggregate return from listing to end-FY24 is 54%, or 4.4% pa, effectively all accounted for by dividends paid. Including dividend reinvestment, CREI calculates a 5.5% pa average total return. The prospective dividend yield is significantly higher than the income return on NAV as a result of the discount to NAV at which the shares are trading.
For FY24, CREI declared four quarterly dividends of 1.375p, meeting its annual target of at least 5.5p. To reflect a continuing strong leasing performance, earnings-accretive disposals and the company’s confidence in the outlook, a special dividend of 0.3p took the total distribution for the year to 5.8p. The FY25 DPS target was increased to 6.0p, a 9% uplift on the FY24 target, excluding the special dividend.

In line with the broad sector, capital returns have been significantly affected by the adjustments of property values across the UK commercial property sector to increased bond yields and economic uncertainty. With DPS growth accelerating, income should continue to drive total return, even though capital values show increasing signs of stabilisation and may well benefit from the expected decline in interest rates.

The greater stability of CREI’s income return as a percentage of NAV compared with more volatile capital returns is consistent with across-the-cycle sector returns, but the contribution from income to CREI’s returns is above the sector average, which we estimate to be c 70%.


While capital returns are volatile, we note that in FY24 the like-for-like valuation decline on the CREI portfolio of 4.0% compared favourably to the 5.7% decline indicated by MSCI quarterly data. The 11.8% like-for-like capital value decline was also less than the broad market decline of c 17%.
CREI’s NAV decreased by 5.9% during the year but, in step with property valuations, at an increasingly slower rate quarter-on-quarter, as the impact of higher interest rates and investor sentiment became fully reflected in valuations. Including the benefit of disposal gains, Q424 NAV per share showed a marginal increase. The company expects the first move down in interest rates to provide a catalyst for a positive shift in sentiment towards real estate investment and a potential turning point in the market.
We forecast continuing organic growth in earnings and dividends
Our last published forecasts followed the company’s Q424 update in early May and reflected the FY24 special dividend and increase in FY25 DPS target. The published data for EPRA earnings, net assets and dividends show no material differences to the unaudited Q4 data, nor to our forecasts. In aggregate there is little change to our FY25 forecasts, although the composition has shifted, with slightly slower growth in net rental income offset by lower administrative costs. Our newly introduced FY26 forecasts show modest further advances in earnings and fully covered DPS.
During Q4 and in the year to date, CREI has sold five assets for an aggregate consideration of £29.5m, on average 21% ahead of book value. This will limit the growth of rental income in the current year but will reduce void property costs, and the repayment of more expensive variable rate borrowing from the proceeds will reduce interest expense. We estimate a blended gross yield (before property costs) on the disposals of less than 4%, well below the c 7% marginal cost of debt.
Aside from the impact of disposals, we have only assumed modest growth in underlying contracted rents. This could prove conservative compared with the significant rent reversion opportunity in the portfolio, discussed in more detail later in this report. The end-FY24 estimated rental value (ERV) of £49.4m was £6.3m, or 15%, above passing contracted rent of £43.1m.
Our previous forecast had assumed flat property valuations through H224 and a higher NAV than reported. Looking forward, we have assumed some modest valuation upside, driven by leasing progress and a broadly unchanged net initial yield.

Smaller lot-size yield premium supports portfolio income
Since IPO, CREI has sought to provide enhanced income returns from UK real estate by following a smaller lot-sized, regional property strategy. Its portfolio is built on a balance of core and core-plus strategies, or core/core-plus. The core strategy is expected to deliver stable, long-term income from well-let, good-quality, predominantly smaller regional properties in attractive locations. The core-plus strategy provides the opportunity to enhance income through asset management initiatives such as lease renewals, regears and new lets and refurbishment. Taken together, CREI aims to generate better risk-adjusted returns than would be possible from a core strategy alone, without a material increase in the volatility of underlying asset values.
The investment strategy does not target value-add acquisitions, often requiring significant improvement and void reduction measures, although the company will invest to reposition existing assets when there is the potential for attractive risk-adjusted returns. The investment policy allows for the redevelopment of properties already owned to a limit of 10% of gross assets. To be clear, CREI will not acquire land assets or properties with the intention of development or redevelopment. The purpose is to provide additional flexibility to enhance asset quality, including environmental performance, to better meet the demands of tenants and drive income growth.
Comparing the transaction net initial yields for properties below £10m with the transaction net initial yields for properties above £10m on a 12-month rolling basis, over the past 20 years or so the yield spread of sub-£10m transactions over those of more than £10m has averaged c 1.1%.

The higher yield on smaller properties is often considered to reflect higher risk and, typically, a higher cost of management relative to income. However, smaller size does not in itself determine the quality of the property, its appeal to tenants or the quality of tenant. While there may be less competition for smaller assets from investors, there is an active owner-occupier market that supports vacant possession values and mitigates valuation risk. Asset selection and a long-term approach to investment are key to managing risk and hence CREI’s strategy for producing an attractive risk-adjusted income return, more than sufficient to offset the additional administrative complexity. Other key elements of CREI’s investment strategy for achieving above-average, risk-adjusted returns include:
- diversification by asset, tenant and geographical location, which may be made easier by having a larger number of smaller properties;
- a focus on areas with high residual values; and
- regional locations with strong local economies and favourable demand-supply characteristics.
Diversification provides income resilience
Portfolio diversification provides a mitigation to income risk and CREI’s portfolio is well spread across the main commercial property sectors and by geographic location, as well as by the number of properties and tenants.
There were 155 properties in the portfolio at end-FY24, let to 335 individual tenants. The top 10 tenants represented c 23% of the total. Although the properties are smaller, the list of tenants includes many well-known and well-established businesses and the overall tenant risk rating is strong.

Diversified but not passively positioned
Although CREI’s portfolio is split between the main property sectors, in line with the company’s objective of maintaining a suitably balanced portfolio, it is actively weighted, with a high level of exposure to the industrial, retail warehouse and alternative sectors (‘other’, including pubs and restaurants, gymnasiums, drive-through restaurants, car showrooms, leisure, units and trade counters), with relatively low exposure to offices and high street retail.
")
")
The key themes to CREI’s portfolio positioning include:
- Industrial and logistics assets where, outside of the very large ‘big box’ segment, low vacancy rates and strong occupier demand continue to drive rental growth.
- Retail warehousing, where a combination of convenience, lower costs per square foot and the complementary offer to online retail continues to support trading at these assets, most notably among DIY, discounters, homewares and food retailers, which should prove defensive if consumer spending levels decrease.
- Selective regional offices with a focus on strong city centre locations instead of out-of-town business parks.
- Drive-through restaurant expansion, involving acquisition and development, where rental growth is anticipated.
- Selective high street retail assets, in strong trading locations, where rents have stabilised and there is potential for growth.
- Refurbishment of existing property, enhancing the quality of the assets, including ESG credentials, and attractiveness to tenants, to generate higher income and support capital values.
The Investment Property Forum’s second quarterly survey of the year, based on data received from 19 organisations, the forecasts for which were generated between the start of March and mid-May 2024, shows a consensus expectation that the industrial and retail warehouse sectors will continue to show the strongest rental and capital growth and lead overall performance. Nonetheless, positive total returns are expected across all sectors during the period.

Opportunities to grow income
Significant reversion potential while rents continue to increase
In an inflationary environment and with a lack of supply of modern, smaller regional properties, the company expects to see continued rental growth over the year ahead, especially for properties with strong environmental credentials. Additionally, the portfolio contains significant reversionary potential while rents continue to grow.
During FY24, on a like-for-like basis, contractual rental income increased 5.6% and the externally estimated portfolio rental value increased by 3.6%. Growth continued through Q424 with like-for-like growth of 1.7% in contracted rents and ERV increasing 0.8%. EPRA occupancy increased to 91.7% in FY24, from 90.3% at end-FY23. The 15 rent reviews completed in the year were in aggregate at an average 23% premium to the previous passing rent, supporting income and capital values.
Providing a strong opportunity to organically increase income, the end-FY24 ERV of £49.4m was £7.7m or c 18% ahead of cash passing rent of £41.7m and £6.3m or 15% ahead of contracted rent of £43.1m, which included c £1.4m of lease incentives. Void reduction represented £4.1m of the potential upside to income with a further £2.1m of latent rental growth, which will be unlocked at rent review and lease renewal.

The reversionary potential of the portfolio by sector can be seen by comparing EPRA topped-up net initial yield (NIY) to the equivalent yield, which factors in expected rental growth and the letting of vacant units. The significant upside in industrial assets primarily reflects rental potential. For office assets, including those undergoing refurbishment, there is a strong opportunity to reduce voids. High street retail assets are yet to fully reflect the declines in market rents of recent years. For retail warehouse assets, the lower equivalent yield versus the NIY relates primarily to two assets, which were acquired with above market-level rents. The assets, combined with a longer-than-average remaining lease term and strong tenant covenant, compensates for the potential rebasing of rents at lease maturity.

Although having increased over the past year, EPRA occupancy remains below the average of 95% since listing, primarily due to the level of refurbishment activity seen in the past two years. It is, nonetheless, in line with close peers. While the level of structural vacancy was lower than 8.3% reported, allowing for c 2% of ERV that was under offer to let or sell and the c 1% of ERV subject to refurbishment, timing factors are fairly typical, such that a material opportunity to increase income remains.

Sustainability-driven, profitable capex
The sustainability credentials of the assets in the portfolio have increasingly become ever more important for occupiers and investors and are now central to the asset management. Positively, where investment is required, it is being reflected in greater tenant demand, additional rental growth and, increasingly, in valuations. All ongoing capital works are expected to enhance the valuations of the assets and, once let, increase rents to give a yield on cost of at least 7%.
In FY24, capex amounted to £19.0m, including £2.0m of investment in solar panels primarily and electrical vehicle charging points, spread across a range of assets in different sectors. As a result of improvements embedded in refurbishment programmes, as well as asset disposals, the weighted average share of properties EPC rated A to C increased to 79% in FY24 from 70% in FY23.2The portfolio weighted average EPC score improved to 53 (C) from 58 (C). CREI expects all remaining EPC E-rated properties to be improved by December 2025, and for the two properties containing EPC F-rated units, asset management plans are underway. Where the risk-return balance of investing in properties is unfavourable, they will continue to be sold, often for alternative use.
1 Minimum Energy Efficiency Standards regulations prohibited the leasing of EPC F or G from 2023 and it is expected that from 2027 a rating of at least EPC C will be required, and by 2030 a minimum EPC B.

More broadly, CREI’s approach and strategic objectives are set out in its June 2024 Asset Management and Sustainability report and its 2023 Environmental, Social and Governance report.
Funding flexibility and interest rate protection
The end-FY24 loan to value (LTV) ratio was 29.2% and on a pro-forma basis, adjusted for subsequent property sales,3 it was c 28%.
2 The c £11.3m sales of an industrial unit in Warrington and a car showroom in Redhill, held for sale at end-FY24.
End-FY24 borrowings were £179m, from total facilities of £190m, or £215m including an accordion option at the discretion of the lender. Drawn borrowings comprised £140m (78% of the total) of long-term fixed-rate debt, at a blended interest cost of 3.4%, with a six-year average maturity and £39m of floating rate debt drawn from the company’s revolving credit facility (RCF). Although relatively more expensive, the RCF provides funding flexibility, and its usage has continued to reduce as a result of disposals. In all, the weighted average cost of aggregate borrowings at end-FY24 was 4.1%.
With the RCF facility extended by three years during FY24, the first debt maturity, the £20m Scottish Widows facility, is not until August 2025. The £50m RCF facility can be increased to £75m under an accordion facility, subject to lender approval, and CREI has an option to extend the maturity of the facility by a up to two years, from November 2026 to November 2028. We see no obstacles to refinancing the 2025 debt maturity, albeit it is likely to be at a higher cost than the current 3.9%. However, if interest rates decline in line with the market consensus, given the modest size of the facility, the impact on CREI’s borrowing costs would be minimal. At the time of writing the UK five-year swap rate is c 4%, providing a benchmark for refinancing at current market levels, to which a lending margin of perhaps 2% should be added.

Gearing is ahead of its medium-term target of 25%, but there is significant headroom against debt covenants.4 With a substantial pool of assets unencumbered by borrowings (£105m at end-FY24), property valuations would need to decrease by 17% from the end-FY24 level to risk breaching the overall LTV covenant.
3 Each debt facility has a discrete security pool over which the relevant lender has security and covenants. The maximum LTV covenant for each discrete security pool is in a range of 45% to 50%, with overarching maximum LTV covenants on the property portfolio of between 35% and 40%. The interest cover covenants require net rental income from each discrete security pool, over the preceding three months, to exceed 200%–250% of the facility’s quarterly interest liability. The debt facilities contain market-standard cross-guarantees such that a default on an individual facility will result in all facilities falling into default.
The rate of loss or deferral of contractual rent on the borrowing facility with least headroom would need to deteriorate by 10%5 to breach interest cover covenants, assuming no unencumbered assets were charged. This is the Scottish Widows £20m facility that expires in August 2025. To breach the interest cover covenant on the facility with the second-least headroom would require a 22% loss of rental income.
4 From the levels included in the company’s ‘prudent’ base case forecasts.
Valuation and performance
CREI’s 6.0p target DPS for FY25 represents a prospective yield of 7.8%. Meanwhile, the shares trade at an 18% discount to the FY24 NAV per share of 93.4p.


The table below compares CREI with a selected group of peers, all targeting income from diversified portfolios. The list has narrowed considerably in the past two years as a result of the corporate activity referred to above and looks likely to narrow further. Corporate activity has had an impact on relative share price performances and valuations and continues to do so.
CREI trades on a slightly higher P/NAV than the average of the group but less so than has been the case for most of the period since listing. Its trailing yield is broadly in line with peers, not yet reflecting the targeted dividend growth on a fully covered basis6 and the company’s focus on smaller lot-size properties, with a premium yield, has historically supported risk-adjusted income returns.
5 API has reported cover for the three months to 31 March 2024 (Q124) of 75.4% (December 2023: 83.4%), excluding exceptional items associated with corporate activity.

Summary of FY24 results published in June 2024
FY24 results were published in June 2024, although a number of key financial and operational performance metrics were available in the four quarterly reports published through the year. For the year as a whole, growth in rental income and lower costs more than offset the drag of higher borrowing costs such that dividend growth, including the special dividend, was fully covered by EPRA earnings.

Exhibit 20 shows a summary of the FY24 results. We highlight the following:
- Net rental income increased by £1.8m (5%) to £38.9m, driven by rental growth. A change in the accounting treatment for dilapidation receipts (£0.5m) increased reported property revenues and direct property costs. Adjusting for this, property costs were broadly flat.
- Administrative expenses decreased £0.7m to £5.3m, including a £0.4m decline in investment manager fees, directly linked to NAV. As a result, the EPRA cost ratio (excluding direct property costs) improved to 17.7%, compared with 18.7% in FY23. Also excluding direct property costs, the ongoing charge ratio was broadly flat at 1.24% (FY23: 1.23%) with the positive impact of lower costs offset by lower average net assets.
- Net finance expense increased by £1.7m to £8.0m, reflecting both higher average debt drawn and a higher average cost of debt. Disposal proceeds during the year were broadly matched by capex. Base rate (SONIA) increased from 4.2% to 5.2% during the year, with an impact on the cost of floating rate borrowing.
- EPRA earnings increased £0.9m (4%) to £25.7m or 5.8p per share.
- Including the 0.3p per share special dividend, DPS declared increased by 5.5% to 5.8p, fully covered by EPRA earnings.
- Including unrealised property losses of £27.0m, partly offset by net gains on disposal of £1.4m, and £1.6m of abortive transaction costs, there was a modest £1.5m loss on an IFRS basis.
- After payment of dividends, net assets and EPRA net tangible assets per share (EPRA NTA) were both lower at 93.4p, compared with 99.3p at end-FY23. Including DPS paid, the total return was a negative 12.5% (FY22: 28.4%).
- Including DPS paid, the NAV total return was 0.3% or 0.4% assuming reinvestment of dividends compared with -12.5% (-12.3%) in FY23.

Portfolio summary and characteristics
Adapting to market changes
Although CREI’s smaller lot-size strategy has remained constant, the pool of suitable properties for investment has evolved over time, in step with market changes, and the stated investment policy has been adjusted to match. This primarily relates to the specified maximum lot size and the minimum weighted average unexpired lease term (WAULT).
At the AGM held in 2023, shareholders approved a change in the company’s target portfolio characteristics from ‘properties with individual values of less than £15m at acquisition’ to ‘smaller, regional, core/core plus properties that provide enhanced income returns’. The £15m limit had been approved by shareholders in 2022, an increase from the £10m in place since 2016 and £7.5m prior to that. Irrespective of this change, the company says that smaller properties will remain the overwhelming focus of its strategy, allowing it to operate below the general level of institutional demand. The portfolio average lot size is just under £4m. During FY24, CREI made no acquisitions and was focused on capital recycling, using disposal proceeds to invest in the existing portfolio and reduce borrowings. In FY23, acquisitions amounted to c £53m, with an average consideration of a little under £7m, within a range of £15.0m (a retail park in Nottingham) and £3m (two drive-through restaurants in York).
To reflect market shifts, including increasing tenant demand for shorter and more flexible leases,7 the 2020 AGM removed the restriction that all new investments should have a minimum WAULT of five years. This allows CREI to focus on asset quality and opportunities to create value on a sustainable basis through re-lettings and lease re-gears. Leases representing approximately one-third of gross contracted rents, or c £14m, mature over the next three years. The end-FY24 WAULT was 4.9 years, a similar level to that of the past five years. At 31 March 2024 (end-FY24), the externally assessed fair value of the investment portfolio was £589m (the balance sheet value includes an adjustment for lease incentives and finance leases), reflecting an EPRA topped-up net initial yield of 6.6% and an equivalent yield of 7.5%.
6 In some cases, driven by changes to the International Financial Reporting Standard 16 (IFRS 16) requiring all lease liabilities to be recognised on the balance sheet.
During FY24, no properties were acquired, and five properties were sold, for an aggregate consideration of £18.2m, a weighted average premium of 12% to the end-FY23 valuation. Since period-end, CREI has sold a vacant industrial unit in Warrington for £9.0m and a vacant former car showroom in Redhill for £2.3m, which had an aggregate year-end value of £11.3m.

At end-FY24, the top 10 tenants represented c 23% of overall rent roll, with rents from the largest tenant, Menzies Distribution, spread over eight individual assets. Menzies is one of the UK’s leading urban logistics businesses.

Additional details on the company and management
Custodian Property Income REIT is an externally managed UK REIT, listed on the Main Market of the London Stock Exchange. Its stated purpose is to offer investors the opportunity to access a diversified portfolio of UK commercial real estate, with strong environmental credentials, which can provide an attractive level of income and the potential for capital growth. It aims to be the REIT of choice for private and institutional investors seeking high and stable dividends from well diversified UK real estate.
The board
CREI’s board of directors comprises six members, all of whom are non-executive and five of whom are deemed independent. The board is chaired by David MacLellan, who joined the board in May 2023, taking over from David Hunter as chair on his retirement from the board at the 2023 AGM after nine years of service. David has more than 35 years’ experience in private equity and fund management and has an established track record as chair and as a non-executive director of public and private companies.
The other directors are Hazel Adam, who joined the board in December 2019, bringing a range of experience including in the buy-side and sell-side investment industry, strategies and markets; Elizabeth McMeikan, a former Tesco (LON:TSCO) executive and experienced board member, appointed in March 2021; Chris Ireland, a former CEO of JLL UK and former chair of the Investment Property Forum, who also joined the board in March 2021; Malcolm Cooper, who has extensive board experience and a background in corporate finance, infrastructure and property, and who joined the board in June 2022; and Ian Mattioli, who as CEO of Mattioli Woods and a board member of the investment manager, is deemed not to be independent. Ed Moore, finance director of Custodian Capital, is company secretary to CREI. Full details of the board can be found on the company’s website.
The investment manager
The company is externally managed by Custodian Capital, a wholly owned subsidiary of Mattioli Woods. Custodian Capital was appointed investment manager at the IPO, an arrangement that is subject to regular board review. Richard Shepherd-Cross is the managing director of Custodian Capital and the fund manager of CREI. He is a former director of Jones Lang LaSalle in London, where he led the portfolio investment team before joining Mattioli Woods in 2009, with responsibility for its syndicated property initiative, the precursor to Custodian. Richard is supported by Custodian Capital’s other key personnel, including Ed Moore (finance director), Alex Nix (assistant investment manager) and Tom Donnachie (portfolio manager), along with a team of five other surveyors and four accountants
Management and administration fees are paid to the manager on a sliding scale that allows shareholders to benefit from growth in NAV.
- Property management fees are charged at 0.90% pa on average net assets of up to £200m, 0.75% pa between £200m and £500m, 0.65% between £500m and £750m, and 0.55% above £750m.
- Administrative fees are charged at 0.125% pa on average net assets up to £200m, 0.115% pa between £200m and £500m, 0.020% between £500m and £750m and 0.015% above £750m.
Sensitivities
The commercial property market is cyclical, historically exhibiting substantial swings in valuation through cycles. Income returns are significantly more stable, but still fluctuate according to tenant demand and rent terms. From a sector viewpoint, we also highlight the increased risks and uncertainties that attach to development activity, including planning consents, timing, construction risks and the long lead times to completion and eventual occupation. CREI’s development exposure is modest and limited to the improvement of existing properties. In this respect, it may best be seen as an extension of its refurbishment activity, aimed at enhancing long-term income growth and returns. Forward-funded development activity is likewise modest and, in our view, very low risk. More generally, we note the sensitivity to:
- Economic risk: the war in Ukraine, sharply rising inflation and a continuing rise in interest rates are creating a high level of uncertainty regarding the global and UK economic outlook. Thus far, occupier demand across most sectors has remained resilient.
- Sector risk: some of the inherent cyclical risk to vacancy in commercial property can be mitigated by portfolio diversification. CREI’s portfolio is highly diversified by asset, sector, tenant and geography, with a focus on properties with higher yields and residual values.
- Energy performance considerations: a failure to successfully meet regulatory and/or tenant expectations for energy performance enhancement would likely affect CREI’s ability to let properties on satisfactory terms and may make properties unlettable.
- Funding risks: at end-FY24, 22% of drawn debt was exposed to interest rate risk, fixed rate and longer term, with no exposure to increased interest rates. With moderate gearing, a significant pool of unencumbered assets and strong interest cover, CREI is well-placed to refinance borrowings that become due, with a first maturity (£20m) in August 2025.
- Management risk: as CREI is externally managed, any management risk is indirect. Custodian Capital, the external manager, operates with a relatively small team and if a senior member of that team were to leave, they would need to be replaced.

General disclaimer and copyright
This report has been commissioned by Custodian Property Income REIT and prepared and issued by Edison, in consideration of a fee payable by Custodian Property Income REIT. Edison Investment Research standard fees are £60,000 pa for the production and broad dissemination of a detailed note (Outlook) following by regular (typically quarterly) update notes. Fees are paid upfront in cash without recourse. Edison may seek additional fees for the provision of roadshows and related IR services for the client but does not get remunerated for any investment banking services. We never take payment in stock, options or warrants for any of our services.
Accuracy of content: All information used in the publication of this report has been compiled from publicly available sources that are believed to be reliable, however we do not guarantee the accuracy or completeness of this report and have not sought for this information to be independently verified. Opinions contained in this report represent those of the research department of Edison at the time of publication. Forward-looking information or statements in this report contain information that is based on assumptions, forecasts of future results, estimates of amounts not yet determinable, and therefore involve known and unknown risks, uncertainties and other factors which may cause the actual results, performance or achievements of their subject matter to be materially different from current expectations.
Exclusion of Liability: To the fullest extent allowed by law, Edison shall not be liable for any direct, indirect or consequential losses, loss of profits, damages, costs or expenses incurred or suffered by you arising out or in connection with the access to, use of or reliance on any information contained on this note.
No personalised advice: The information that we provide should not be construed in any manner whatsoever as, personalised advice. Also, the information provided by us should not be construed by any subscriber or prospective subscriber as Edison’s solicitation to effect, or attempt to effect, any transaction in a security. The securities described in the report may not be eligible for sale in all jurisdictions or to certain categories of investors.
Investment in securities mentioned: Edison has a restrictive policy relating to personal dealing and conflicts of interest. Edison Group does not conduct any investment business and, accordingly, does not itself hold any positions in the securities mentioned in this report. However, the respective directors, officers, employees and contractors of Edison may have a position in any or related securities mentioned in this report, subject to Edison's policies on personal dealing and conflicts of interest.
Copyright: Copyright 2024 Edison Investment Research Limited (Edison).
Australia
Edison Investment Research Pty Ltd (Edison AU) is the Australian subsidiary of Edison. Edison AU is a Corporate Authorised Representative (1252501) of Crown Wealth Group Pty Ltd who holds an Australian Financial Services Licence (Number: 494274). This research is issued in Australia by Edison AU and any access to it, is intended only for "wholesale clients" within the meaning of the Corporations Act 2001 of Australia. Any advice given by Edison AU is general advice only and does not take into account your personal circumstances, needs or objectives. You should, before acting on this advice, consider the appropriateness of the advice, having regard to your objectives, financial situation and needs. If our advice relates to the acquisition, or possible acquisition, of a particular financial product you should read any relevant Product Disclosure Statement or like instrument.
New Zealand
The research in this document is intended for New Zealand resident professional financial advisers or brokers (for use in their roles as financial advisers or brokers) and habitual investors who are “wholesale clients” for the purpose of the Financial Advisers Act 2008 (FAA) (as described in sections 5(c) (1)(a), (b) and (c) of the FAA). This is not a solicitation or inducement to buy, sell, subscribe, or underwrite any securities mentioned or in the topic of this document. For the purpose of the FAA, the content of this report is of a general nature, is intended as a source of general information only and is not intended to constitute a recommendation or opinion in relation to acquiring or disposing (including refraining from acquiring or disposing) of securities. The distribution of this document is not a “personalised service” and, to the extent that it contains any financial advice, is intended only as a “class service” provided by Edison within the meaning of the FAA (i.e. without taking into account the particular financial situation or goals of any person). As such, it should not be relied upon in making an investment decision.
United Kingdom
This document is prepared and provided by Edison for information purposes only and should not be construed as an offer or solicitation for investment in any securities mentioned or in the topic of this document. A marketing communication under FCA Rules, this document has not been prepared in accordance with the legal requirements designed to promote the independence of investment research and is not subject to any prohibition on dealing ahead of the dissemination of investment research.
This Communication is being distributed in the United Kingdom and is directed only at (i) persons having professional experience in matters relating to investments, i.e. investment professionals within the meaning of Article 19(5) of the Financial Services and Markets Act 2000 (Financial Promotion) Order 2005, as amended (the "FPO") (ii) high net-worth companies, unincorporated associations or other bodies within the meaning of Article 49 of the FPO and (iii) persons to whom it is otherwise lawful to distribute it. The investment or investment activity to which this document relates is available only to such persons. It is not intended that this document be distributed or passed on, directly or indirectly, to any other class of persons and in any event and under no circumstances should persons of any other description rely on or act upon the contents of this document.
This Communication is being supplied to you solely for your information and may not be reproduced by, further distributed to or published in whole or in part by, any other person.
United States
Edison relies upon the "publishers' exclusion" from the definition of investment adviser under Section 202(a)(11) of the Investment Advisers Act of 1940 and corresponding state securities laws. This report is a bona fide publication of general and regular circulation offering impersonal investment-related advice, not tailored to a specific investment portfolio or the needs of current and/or prospective subscribers. As such, Edison does not offer or provide personal advice and the research provided is for informational purposes only. No mention of a particular security in this report constitutes a recommendation to buy, sell or hold that or any security, or that any particular security, portfolio of securities, transaction or investment strategy is suitable for any specific person.
London │ New York │ Frankfurt
20 Red Lion Street
London, WC1R 4PS
United Kingdom