Copper’s rally this year was huge, but there’s something even bigger: China’s price squeeze.
After the world’s most in-demand base metal reached record highs of $10,746 a tonne on the London Metal Exchange on May 10, its biggest buyer decided that enough was enough.
Through a systematic reduction of copper imports in the weeks that followed—the cutback actually began in April, but deepened last month—China has managed to shave 8% off those peak prices, forcing the metal below its key bullish $10,000 level by Tuesday’s trade.
And the correction may just be beginning, based on charts signals, as well as on-again/off-again talks about Federal Reserve asset tapering, as the June meeting of the US central bank looms.
 All charts courtesy of SK Dixit Charting
The slowdown in China’s copper consumption is, of course, concerning for bulls but that’s not their sole worry, ING said in an outlook published Monday.
“Speculations about Fed tapering could lead to strong market gyrations and a bumpy road ahead for copper,” Wenyu Yao, senior commodities strategist at ING said in the outlook.

The Fed appears to be in the early stages of a campaign to mentally prepare markets for a reduction of its $120 billion monthly asset purchases, which it has been doing for the past year to stimulate the pandemic-stifled US economy, CNBC said in a markets roundup.
Comments by Fed officials in the past several weeks suggest the issue of tapering looks likely to be discussed when the central bank’s all-powerful Federal Open Markets Committee meets on June 15-16.
At least five Fed officials have publicly commented on the likelihood of such discussions in recent weeks, including Patrick Harker of the Philadelphia Fed, Robert Kaplan (Dallas) and Loretta Mester (Cleveland), as well as Fed Vice Chair for bank supervision Randal Quarles.
Speculation about a Fed taper—which some economists still doubt given the disappointing performance of US nonfarm payrolls in May—is intensifying the weight on copper prices already hit by the China import reductions.
Preliminary trade data released by China’s customs authorities on Monday showed that imports of refined copper and copper products fell by more than 8% month-on-month (perfectly aligning with the price drop from the record highs) to 446,000 tonnes in May.
The second consecutive month of falling copper imports affected mostly copper cathodes (90%), and some alloy products as well, the data showed. Looking at cathode alone, imports fell by 10% month-on-month in April to just below 320,000.
Says Yao of ING:
“To be clear, China is still the largest copper importer, but exports are slowly creeping up, so as a result net imports have started to dwindle. The contraction in imports is not something happening out of the blue, but the underlying causes are worth paying attention to.”
What are these?
Firstly, the record high copper prices received rising pushback from the world's largest consumer, with some physical buyers on the sidelines and manufacturers reportedly trimming down operations. The increasing gap between Chinese PPI and CPI partially implies that many manufacturers stuck in the middle are bearing the brunt of rising costs.
Secondly, appetite for stockpiling copper has been waning, whether it's state-backed or commercial type.
As a result, the cross-market arbitrage in spot copper prices between Shanghai and London has swung in favor of exports by onshore traders instead of imports. China’s domestic premium for copper had also been sliding well before Monday’s export numbers surfaced.
To balance things up, the trade-weighted Dollar Index fell from its recent peak above 93 at the end of March to below 90 at mid-May, during the period copper hit its record. However, since then, the dollar has been broadly caught in a large range-bound pattern The caveat could be that there's a bumpier road ahead for copper for the rest of the year.
What about copper charts?
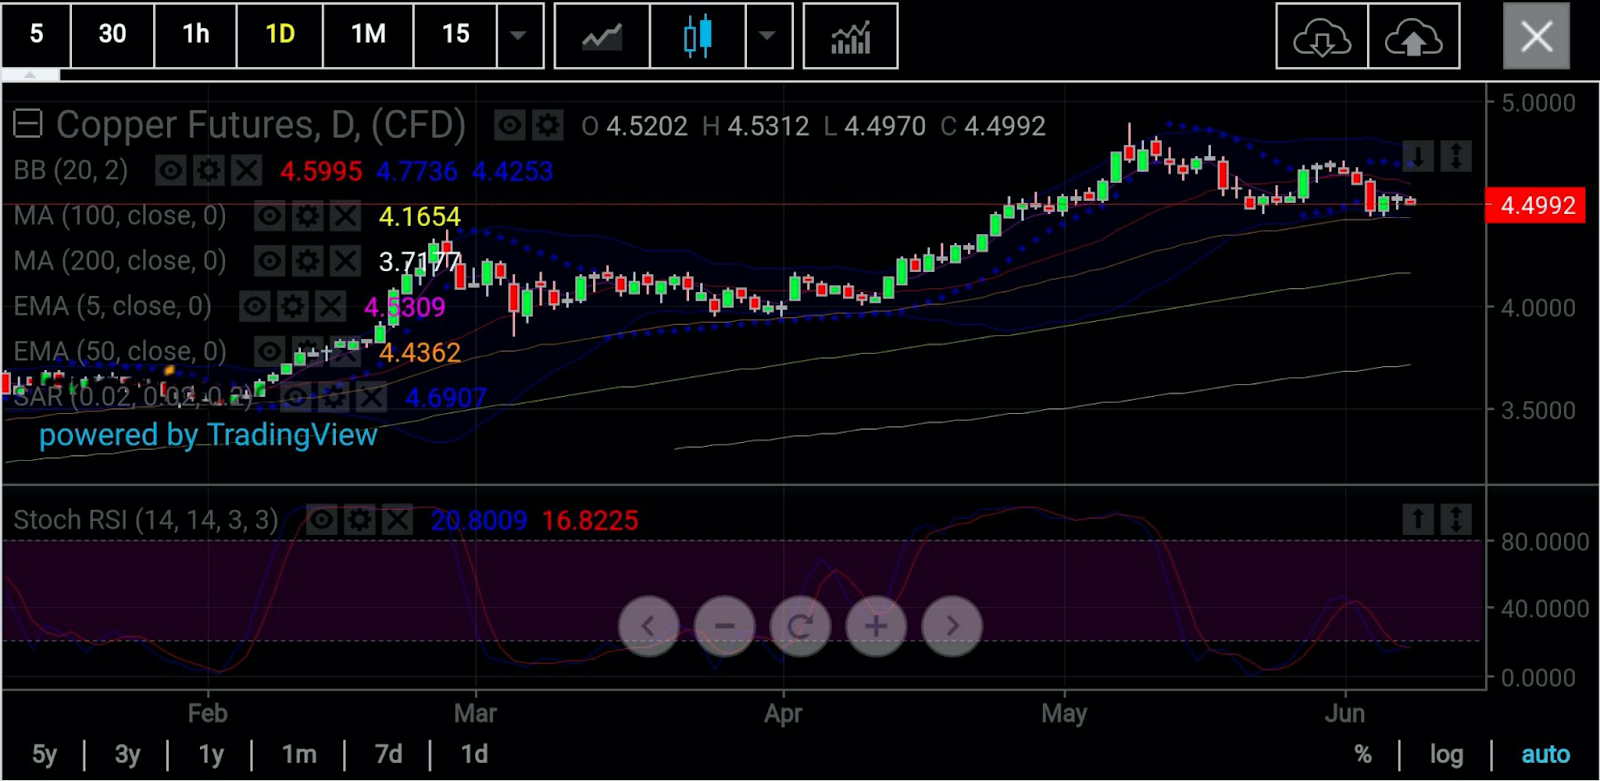
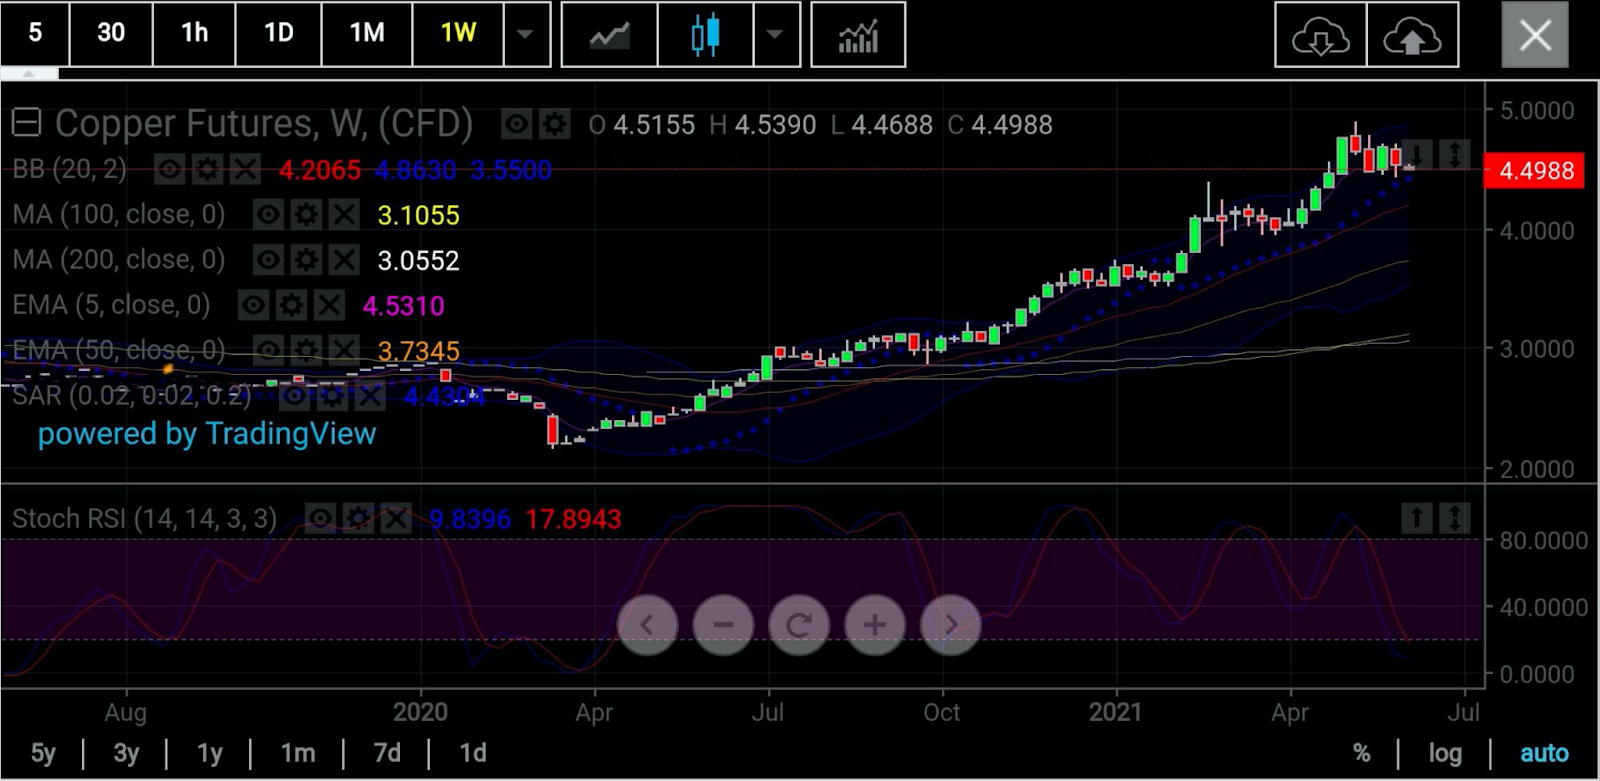
They show prices moving in a descending channel with sideways to downside consolidation, says Sunil Kumar Dixit of SK Dixit Charting, in Kolkata, India.
Laying out his technical study of New York-traded copper futures, Dixit said:
“The 50-Day Exponential Moving Average of $4.43 has been acting as good support for the short term, while the middle Bollinger® Band seems to be a resistance with the 20-Day Simple Moving Average at $4.60.”
“Stochastic RSI positivity is reflected in an attempt to cross over from oversold areas, with a reading of 20/16."
“If the 50-Day EMA $4.43 holds good, look for an up move with initial targets of $4.60 and $4.90. Failure to hold above $4.43 may push the metal down to $4.30 and $4.10.”
Disclaimer: Barani Krishnan uses a range of views outside his own to bring diversity to his analysis of any market. For neutrality, he sometimes presents contrarian views and market variables. He does not hold a position in the commodities and securities he writes about.
