Market Overview
There is a sense of consolidation taking over markets as a couple of key events loom that could help to mould a view on prospective Fed monetary policy. Firstly tonight the FOMC minutes for the July meeting will be eyed to see just how dovish the committee now is. There is a pricing for a rate cut in the September meeting, but increasingly dovish leanings from the minutes would help to cement future cuts as well.
Beyond that is Jerome Powell’s speech at Jackson Hole which will also be watched closely. There is a consolidation on Treasury yields, whilst on the technicals there are consolidation patterns forming on major markets such as EUR/USD, Gold, USD/JPY and Cable. With regards to Cable however, there has been a tick higher (albeit some given back early today) following comments from German Chancellor Angela Merkel suggesting that the EU would try to find a “practical solution” that would effectively render the Irish Backstop irrelevant. Quite whether this changes the course that seems destined for “no deal” on the 31st October deadline remains to be seen.
The ball is now with PM Boris Johnson again, but this just stokes the fire of intraday volatility on sterling once more. For now there seems to be little market reaction for the euro despite another deterioration in stability for Italian politics as Prime Minister Conte has resigned which increases the potential for further elections. Instability in Italian politics is not unusual but adds another shot to the cocktail of negative factors for traders to factor.
Wall Street closed lower yesterday with the S&P 500 -0.8% at 2900, but with US futures bouncing mildly today by around +0.3% we see a mixed outlook across Asian markets (Nikkei -0.3%, Shanghai Composite +0.1%. European indices are a shade higher around the open with FTSE Futures +0.1% and DAX futures +0.2%.
In forex, there is further consolidation on EUR around $1.1100 whilst GBP is giving back some of yesterday’s gains and JPY continues to chop around. It is interesting to see AUD once more outperforming NZD this morning (see Chart of the Day).
In commodities there is a slip back on gold (still under the near term pivot at $1510), whilst oil is a tick higher after a larger than expected API inventory drawdown.
The economic calendar is once more fairly light today, with a series of lower tier data releases to wade through, but the Fed minutes are the key focus. The UK Public Borrowing deficit is at 0930BST which is expected to show -£2.7bn of borrowing (i.e. a surplus) in July which would be not as large a surplus as the -£3.9bn in July 2018. Canadian CPI inflation is at 1330BST with the Bank of Canada’s core CPI at 2.0% in July. US Existing Home Sales are at 15:00 BST and are expected to improve to 5.39m (from 5.27m in June).
EIA Oil Inventories are at 15:30 BST and are expected to show the crude oil stocks to drawdown by -1.9m barrels (+1.6m barrels last week), with distillates to build by +0.6m barrels (-1.9m last week) and gasoline to build by +0.1m barrels (-1.4m barrels last week). The FOMC minutes for the July meeting are at 1900BST and traders will be focused on any signs that point towards an ongoing series of rate cuts.
Chart of the Day – AUD/NZD
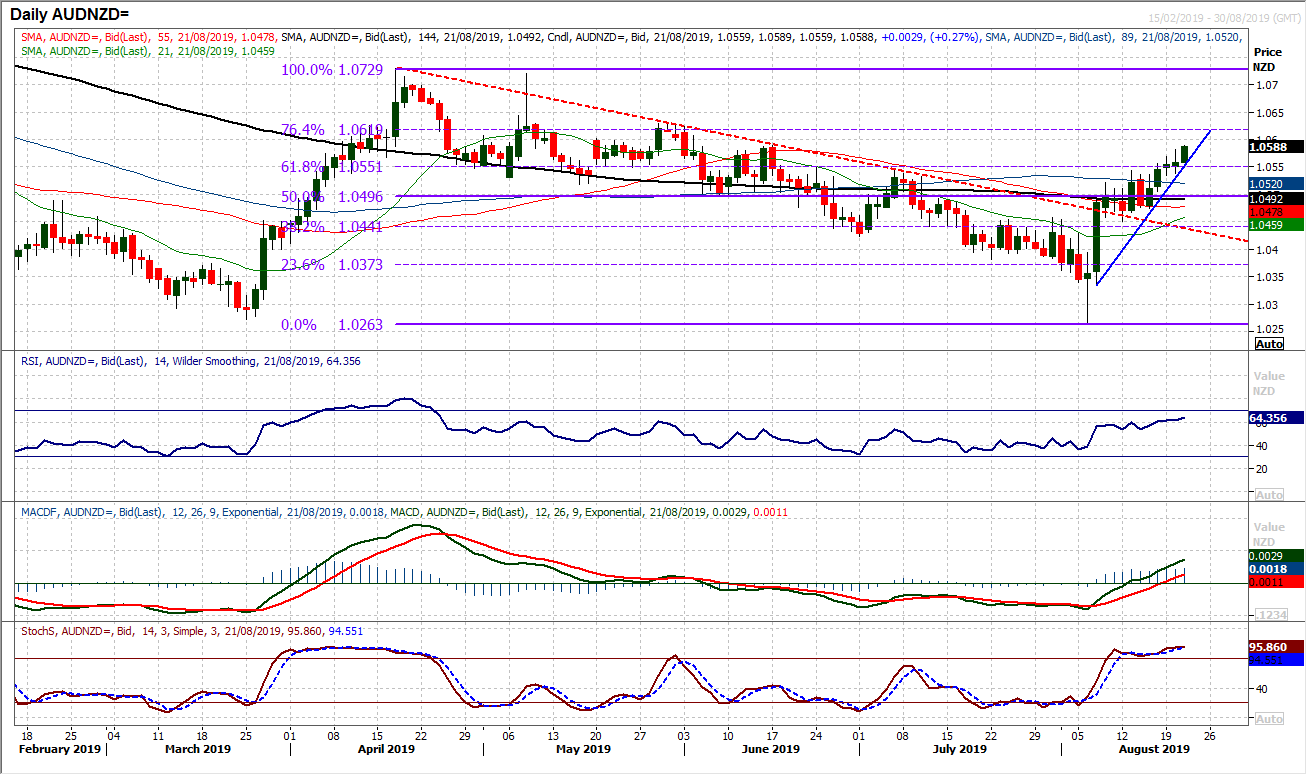
There has been a notable turn around in performance of the Aussie versus the Kiwi. For over four months there was a consistent slide in the Aussie, a run of higher lows and higher highs on AUD/NZD is pushing through resistance of the July high at 1.0545. This has coincided with a push through the 61.8% Fibonacci retracement of 1.0729/1.0263 at 1.0550 to open the 76.4% Fib at 1.0620. This 76.4% Fib also coincides with the May high around 1.0630. Momentum is increasingly strong with the RSI into the 60s (where 60 has limited the previous rebounds since April). The MACD lines are also pulling decisively above neutral whilst the Stochastics are strongly configured. This all suggests buying into weakness now. The hourly chart shows a consistent run of higher lows whilst hourly momentum is positively configured (RSI above 40 and MACD above neutral). Initial support of yesterday’s low at 1.0550 coincides with the 61.8% Fib at 1.0550.

EUR/USD
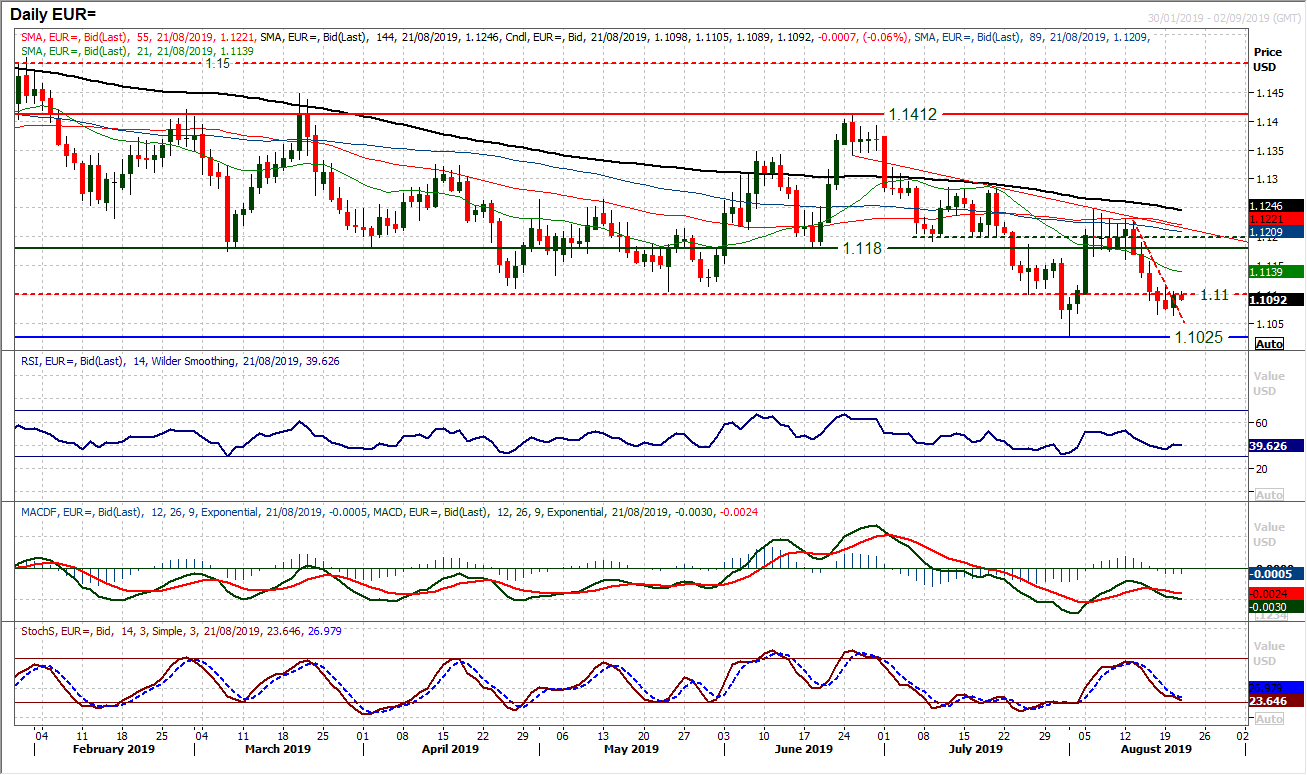
There are signs that the bull move on the dollar is dissipating, at least for the near term. The move lower on EUR/USD which comprised of five consecutive negative candles has begun to form a low around $1.1065. It is interesting that this level has been hit on two separate occasions before support formed. Yesterday’s positive candle now needs to be followed by a second today for the bulls to start to re-engage. There is a degree of settling on momentum indicators, with RSI especially, but also flattening MACD lines and deceleration on Stochastics. There is more of a ranging outlook on the hourly chart too. However there is still the basis of resistance between $1.1100/$1.1120 which needs to be overcome in order to form some sort of near term base reversal (of around 50 pips). A close above would confirm. For now though between $1.1065 and $1.1120 the market is just steady, probably now waiting for at least the FOMC minutes, but perhaps also Fed hair Powell at Jackson Hole.

GBP/USD
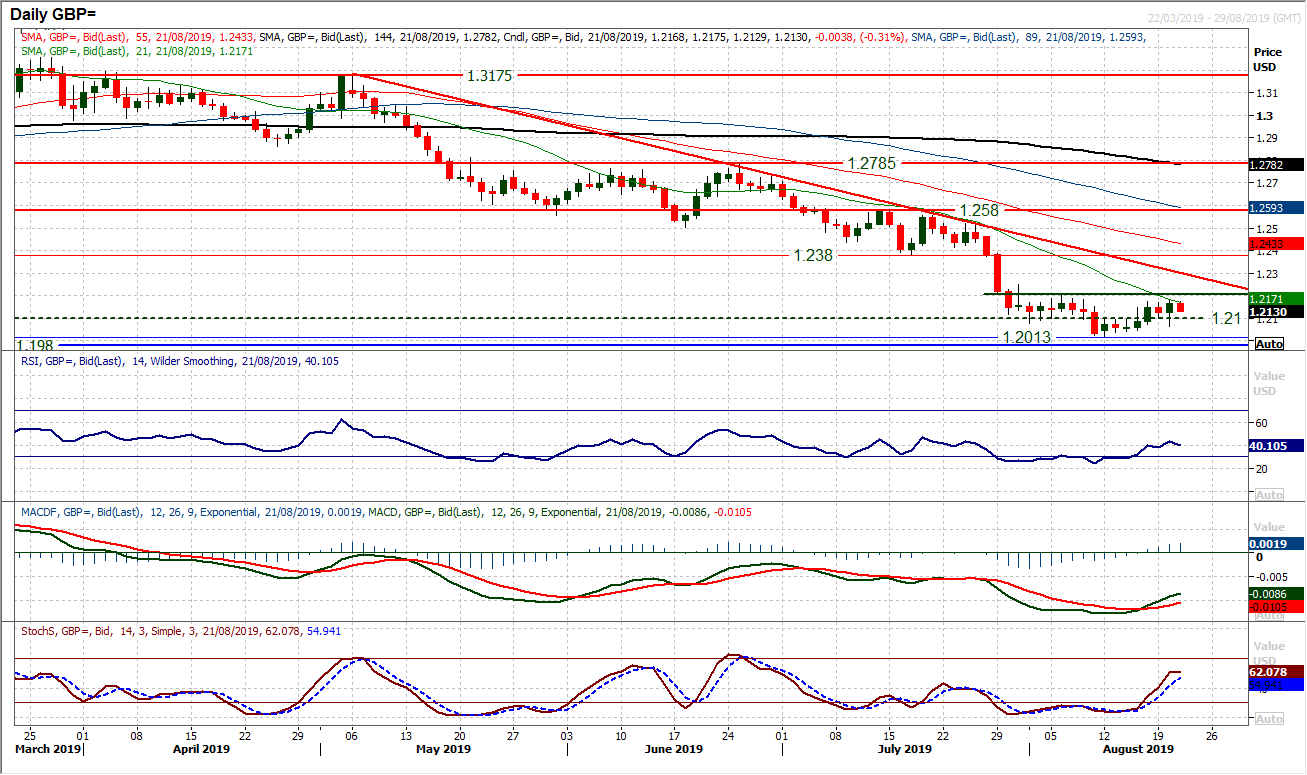
It looked for much of yesterday’s session that the selling pressure was resuming on Cable, but a rally into the close (on constructive comments from Merkel over the Irish backstop) held the market above $1.2100 and maintained what is now an increasingly rangebound period of trading. Resistance overhead between $1.2210/$1.2250 limits the upside, but equally, at least for now, the downside is limited. There is an unwinding look to momentum indicators, but the RSI, and MACD remain well within the confines of negative medium term configuration. The 21 day moving average has been a decent gauge of resistance for a few months now and today comes in at $1.2170. The hourly chart shows a minor positive bias within the range, but with limited traction. Support at $1.2100 and $1.2065.

USD/JPY
We have been consistently highlighting the basis of resistance around 106.75 in recent weeks. This is the bottom of the band of overhead supply 106.75/107.50 and once more seems to be acting as a key barrier to gains. A run of three consecutive positive candles which were eyeing the 106.75 resistance has been broken by yesterday’s negative candle which leaves resistance at 106.70 and adds to the overhead supply. Whilst there is still a marginal improvement to momentum indicators (Stochastics ticking higher and MACD lines still threatening to cross higher) this remains a market stuck under resistance and the bulls are lacking conviction. This move still has the look of a near term rally that will provide the next chance to sell. At best for the bulls, this is now a consolidation market. Initial support at 106.20 helps to build this consolidation but below 105.65 re-engages the bears. A close above 106.75 would create doubt in this outlook, whilst it would need a move above 107.50 to really suggest the bulls have a sustainable traction.
Gold
We have been suggesting over the past week that the gold rally was faltering, but still see a consolidation rather than correction forming. This view was bolstered by yesterday’s positive session which has helped to leave support at $1492 above the key $1481 low. However, there is still a slight negative bias to what is seen as a range now, with the market faltering under a mid-range pivot at $1510 this morning. This would suggest that the bulls still need to be careful, especially given the MACD and Stochastics are beginning to drag lower. Consistent failing under $1510 puts pressure on supports and increases the potential that this consolidation does turn into a corrective top pattern. For now though the market is in consolidation.
WTI Oil
The market has ticked higher again in the past couple of sessions, and how the bulls respond in the coming days could give an important indication of continued direction. The run of lower highs has seen the latest resistance formed around $57.50, but this also left a sharper five week downtrend. This trendline is being tested today at $56.50. There is an uptick on momentum, with Stochastics and MACD lines especially higher. However, indicators retain their negative configuration which suggests that rallies will struggle to sustain traction. If this is the case and resistance $56.50 holds with another lower high under $57.50 then the bears will regain control. The support is $53.75 and yesterday’s low at $55.30.
Dow Jones Industrial Average
There is an increasingly important near term range forming on the Dow. In the past couple of weeks there has been a basis of support between 25,340/25,440 which has restricted the selling pressure. However, on the topside, there is resistance between 26,425/26,465 which has capped the gains. Within these bands are some rather volatile sessions which have elevated the Average True Range to 473 ticks (a seven month high). How the market resolves this choppy trading range could be an outlook defining move. We noted the three positive candles in recent sessions, which have helped to keep the bears at bay, but a move to fill a gap at 25,930 now begins to take the sheen off this move. Another bear candle today would resume focus on the range lows again. Taking a step back, the daily momentum configuration is a consolidation within a medium term negative outlook. The hourly chart is also reflecting this negative bias as indicators roll over again following yesterday’s session. Initial resistance is at 26,222.
"""DISCLAIMER: This report does not constitute personal investment advice, nor does it take into account the individual financial circumstances or objectives of the clients who receive it. All information and research produced by Hantec Markets is intended to be general in nature; it does not constitute a recommendation or offer for the purchase or sale of any financial instrument, nor should it be construed as such.
All of the views or suggestions within this report are those solely and exclusively of the author, and accurately reflect his personal views about any and all of the subject instruments and are presented to the best of the author’s knowledge. Any person relying on this report to undertake trading does so entirely at his/her own risk and Hantec Markets does not accept any liability. """
Market Overview
There is a sense of consolidation taking over markets as a couple of key events loom that could help to mould a view on prospective Fed monetary policy. Firstly tonight the FOMC minutes for the July meeting will be eyed to see just how dovish the committee now is. There is a pricing for a rate cut in the September meeting, but increasingly dovish leanings from the minutes would help to cement future cuts as well. Beyond that is Jerome Powell’s speech at Jackson Hole which will also be watched closely. There is a consolidation on Treasury yields, whilst on the technicals there are consolidation patterns forming on major markets such as EUR/USD, Gold, USD/JPY and Cable. With regards to Cable however, there has been a tick higher (albeit some given back early today) following comments from German Chancellor Angela Merkel suggesting that the EU would try to find a “practical solution” that would effectively render the Irish Backstop irrelevant. Quite whether this changes the course that seems destined for “no deal” on the 31st October deadline remains to be seen. The ball is now with PM Boris Johnson again, but this just stokes the fire of intraday volatility on sterling once more. For now there seems to be little market reaction for the euro despite another deterioration in stability for Italian politics as Prime Minister Conte has resigned which increases the potential for further elections. Instability in Italian politics is not unusual but adds another shot to the cocktail of negative factors for traders to factor.
Wall Street closed lower yesterday with the S&P 500 -0.8% at 2900, but with US futures bouncing mildly today by around +0.3% we see a mixed outlook across Asian markets (Nikkei -0.3%, Shanghai Composite +0.1%. European indices are a shade higher around the open with FTSE futures +0.1% and DAX futures +0.2%. In forex, there is further consolidation on EUR around $1.1100 whilst GBP is giving back some of yesterday’s gains and JPY continues to chop around. It is interesting to see AUD once more outperforming NZD this morning (see Chart of the Day). In commodities there is a slip back on gold (still under the near term pivot at $1510), whilst oil is a tick higher after a larger than expected API inventory drawdown.
The economic calendar is once more fairly light today, with a series of lower tier data releases to wade through, but the Fed minutes are the key focus. The UK Public Borrowing deficit is at 0930BST which is expected to show -£2.7bn of borrowing (i.e. a surplus) in July which would be not as large a surplus as the -£3.9bn in July 2018. Canadian CPI inflation is at 1330BST with the Bank of Canada’s core CPI at 2.0% in July. US Existing Home Sales are at 1500BST and are expected to improve to 5.39m (from 5.27m in June). EIA Oil Inventories are at 1530BST and are expected to show the crude oil stocks to drawdown by -1.9m barrels (+1.6m barrels last week), with distillates to build by +0.6m barrels (-1.9m last week) and gasoline to build by +0.1m barrels (-1.4m barrels last week). The FOMC minutes for the July meeting are at 1900BST and traders will be focused on any signs that point towards an ongoing series of rate cuts.
Chart of the Day – AUD/NZD
There has been a notable turn around in performance of the Aussie versus the Kiwi. For over four months there was a consistent slide in the Aussie, a run of higher lows and higher highs on AUD/NZD is pushing through resistance of the July high at 1.0545. This has coincided with a push through the 61.8% Fibonacci retracement of 1.0729/1.0263 at 1.0550 to open the 76.4% Fib at 1.0620. This 76.4% Fib also coincides with the May high around 1.0630. Momentum is increasingly strong with the RSI into the 60s (where 60 has limited the previous rebounds since April). The MACD lines are also pulling decisively above neutral whilst the Stochastics are strongly configured. This all suggests buying into weakness now. The hourly chart shows a consistent run of higher lows whilst hourly momentum is positively configured (RSI above 40 and MACD above neutral). Initial support of yesterday’s low at 1.0550 coincides with the 61.8% Fib at 1.0550.
There are signs that the bull move on the dollar is dissipating, at least for the near term. The move lower on EUR/USD which comprised of five consecutive negative candles has begun to form a low around $1.1065. It is interesting that this level has been hit on two separate occasions before support formed. Yesterday’s positive candle now needs to be followed by a second today for the bulls to start to re-engage. There is a degree of settling on momentum indicators, with RSI especially, but also flattening MACD lines and deceleration on Stochastics. There is more of a ranging outlook on the hourly chart too. However there is still the basis of resistance between $1.1100/$1.1120 which needs to be overcome in order to form some sort of near term base reversal (of around 50 pips). A close above would confirm. For now though between $1.1065 and $1.1120 the market is just steady, probably now waiting for at least the FOMC minutes, but perhaps also Fed hair Powell at Jackson Hole.
It looked for much of yesterday’s session that the selling pressure was resuming on Cable, but a rally into the close (on constructive comments from Merkel over the Irish backstop) held the market above $1.2100 and maintained what is now an increasingly rangebound period of trading. Resistance overhead between $1.2210/$1.2250 limits the upside, but equally, at least for now, the downside is limited. There is an unwinding look to momentum indicators, but the RSI, and MACD remain well within the confines of negative medium term configuration. The 21 day moving average has been a decent gauge of resistance for a few months now and today comes in at $1.2170. The hourly chart shows a minor positive bias within the range, but with limited traction. Support at $1.2100 and $1.2065.
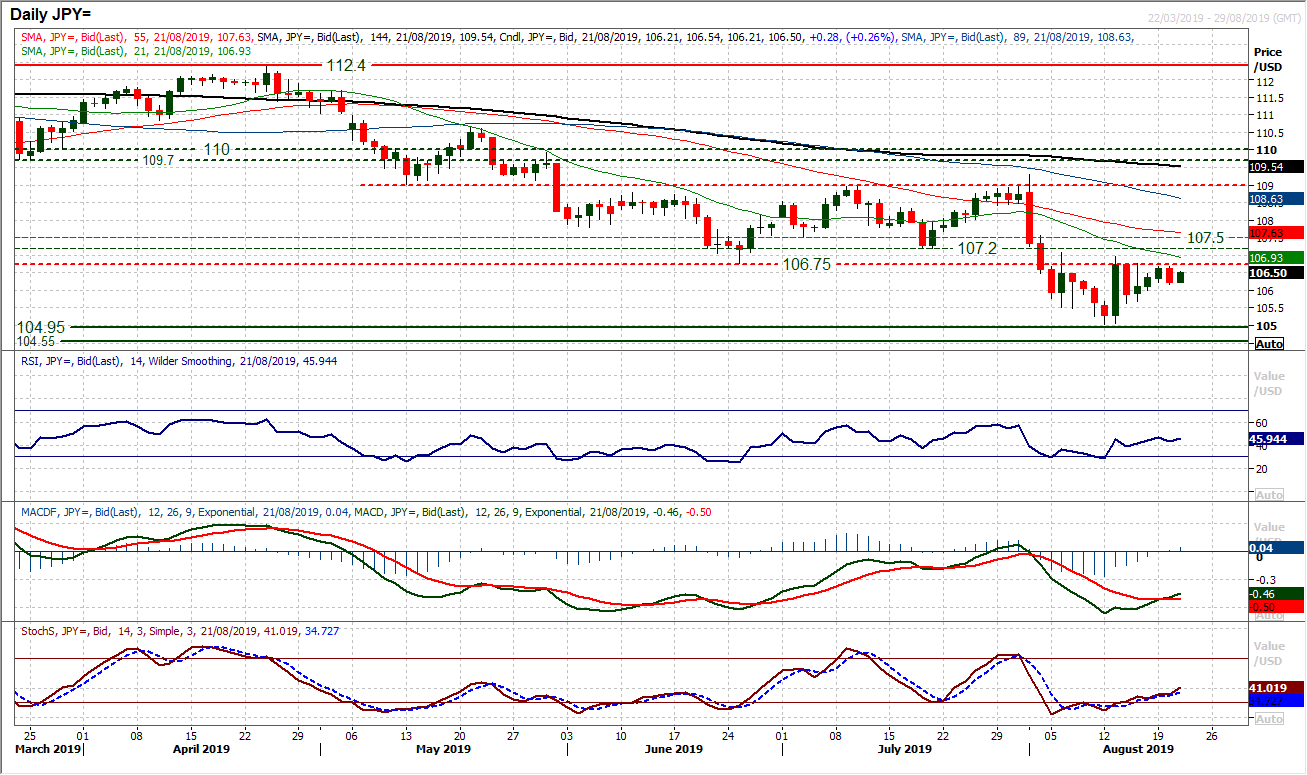
We have been consistently highlighting the basis of resistance around 106.75 in recent weeks. This is the bottom of the band of overhead supply 106.75/107.50 and once more seems to be acting as a key barrier to gains. A run of three consecutive positive candles which were eyeing the 106.75 resistance has been broken by yesterday’s negative candle which leaves resistance at 106.70 and adds to the overhead supply. Whilst there is still a marginal improvement to momentum indicators (Stochastics ticking higher and MACD lines still threatening to cross higher) this remains a market stuck under resistance and the bulls are lacking conviction. This move still has the look of a near term rally that will provide the next chance to sell. At best for the bulls, this is now a consolidation market. Initial support at 106.20 helps to build this consolidation but below 105.65 re-engages the bears. A close above 106.75 would create doubt in this outlook, whilst it would need a move above 107.50 to really suggest the bulls have a sustainable traction.
Gold
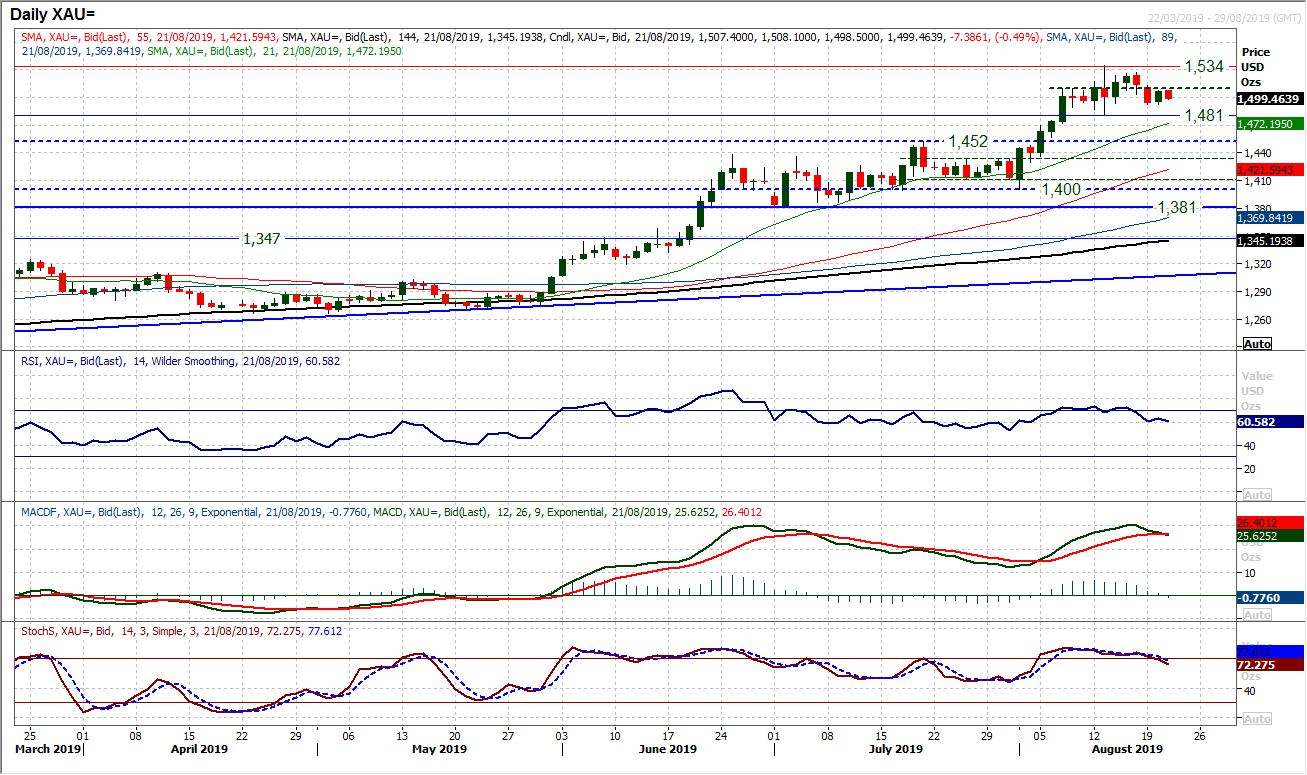
We have been suggesting over the past week that the gold rally was faltering, but still see a consolidation rather than correction forming. This view was bolstered by yesterday’s positive session which has helped to leave support at $1492 above the key $1481 low. However, there is still a slight negative bias to what is seen as a range now, with the market faltering under a mid-range pivot at $1510 this morning. This would suggest that the bulls still need to be careful, especially given the MACD and Stochastics are beginning to drag lower. Consistent failing under $1510 puts pressure on supports and increases the potential that this consolidation does turn into a corrective top pattern. For now though the market is in consolidation.
WTI Oil
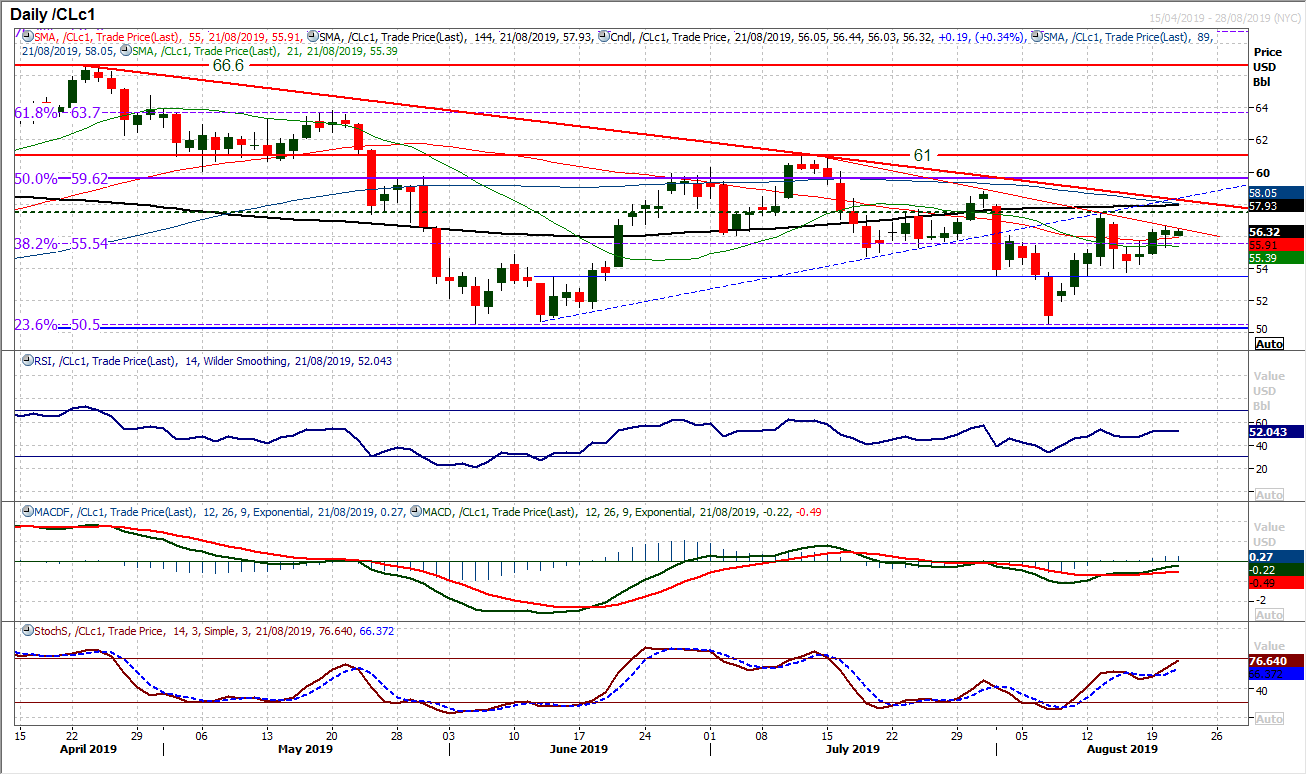
The market has ticked higher again in the past couple of sessions, and how the bulls respond in the coming days could give an important indication of continued direction. The run of lower highs has seen the latest resistance formed around $57.50, but this also left a sharper five week downtrend. This trendline is being tested today at $56.50. There is an uptick on momentum, with Stochastics and MACD lines especially higher. However, indicators retain their negative configuration which suggests that rallies will struggle to sustain traction. If this is the case and resistance $56.50 holds with another lower high under $57.50 then the bears will regain control. The support is $53.75 and yesterday’s low at $55.30.
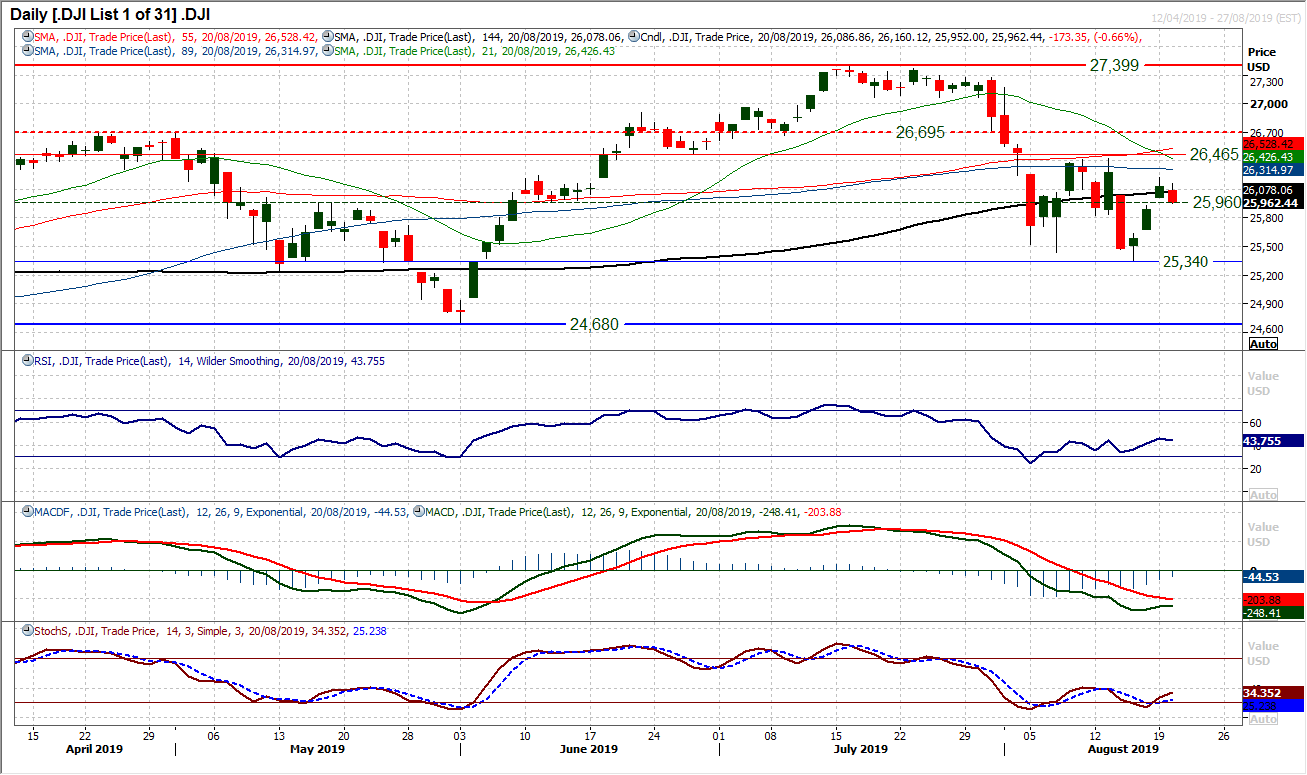
There is an increasingly important near term range forming on the Dow. In the past couple of weeks there has been a basis of support between 25,340/25,440 which has restricted the selling pressure. However, on the topside, there is resistance between 26,425/26,465 which has capped the gains. Within these bands are some rather volatile sessions which have elevated the Average True Range to 473 ticks (a seven month high). How the market resolves this choppy trading range could be an outlook defining move. We noted the three positive candles in recent sessions, which have helped to keep the bears at bay, but a move to fill a gap at 25,930 now begins to take the sheen off this move. Another bear candle today would resume focus on the range lows again. Taking a step back, the daily momentum configuration is a consolidation within a medium term negative outlook. The hourly chart is also reflecting this negative bias as indicators roll over again following yesterday’s session. Initial resistance is at 26,222.
"""DISCLAIMER: This report does not constitute personal investment advice, nor does it take into account the individual financial circumstances or objectives of the clients who receive it. All information and research produced by Hantec Markets is intended to be general in nature; it does not constitute a recommendation or offer for the purchase or sale of any financial instrument, nor should it be construed as such.
All of the views or suggestions within this report are those solely and exclusively of the author, and accurately reflect his personal views about any and all of the subject instruments and are presented to the best of the author’s knowledge. Any person relying on this report to undertake trading does so entirely at his/her own risk and Hantec Markets does not accept any liability. """
Which stock should you buy in your very next trade?
With valuations skyrocketing in 2024, many investors are uneasy putting more money into stocks. Unsure where to invest next? Get access to our proven portfolios and discover high-potential opportunities.
In 2024 alone, ProPicks AI identified 2 stocks that surged over 150%, 4 additional stocks that leaped over 30%, and 3 more that climbed over 25%. That's an impressive track record.
With portfolios tailored for Dow stocks, S&P stocks, Tech stocks, and Mid Cap stocks, you can explore various wealth-building strategies.
