The article was written exclusively for investing.com
US index futures, including the Dow, S&P and NASDAQ, fell overnight, so far unable to build on the mild gains from Thursday. European indices, including the Stoxx 600, were likewise lower at the time of writing.
With the weekend approaching, it remains to be seen whether the sellers will exert further pressure today or we will see a nice rebound, with the major indices reaching key levels amid a mixed macro backdrop.
Wall Street shares have fallen for four weeks, with the S&P pulling back around 10% from its record high. Investor sentiment has been downbeat so far in September. As well as profit-taking from record highs, there has been growing concerns about the disconnect between the economy and the markets.
Besides valuation concerns, the alarming rise in coronavirus cases across Europe and other parts of the world has revived growth concerns, just as the global economy was beginning to recover from the pandemic.
Recent macro data suggests the stimulus-driven US economic recovery may also be stalling, and there is growing uncertainty over whether there will be more fiscal stimulus with the presidential election looming large.
Yet, the selling has not been anything like back in March. Part of the reason for a more sober reaction this time is that investors appear not to be too concerned about the resurgent virus cases in Europe and elsewhere. Death rates have remained very low in Europe this time. There are now a few options to treat critically ill COVID patients, while the approval of an effective vaccine is around the corner.
And let’s not forget the big elephant in the room. Officials from the Fed and other major central banks have been reminding investors that more stimulus may be provided, if the economy warranted it. What’s more, several European countries have already extended their fiscal stimulus support and there is a good chance the US government will follow suit.
With various stimulus measures still ongoing, and more fiscal and monetary stimulus potentially on the way, investors may continue to do what they have done so over the past decade: buy the dip again. Indeed, it is worth noting that some investors who were presumably hoping for a pullback have now got a 10% correction from the record high, which makes it more likely than not that we could see a rebound soon.
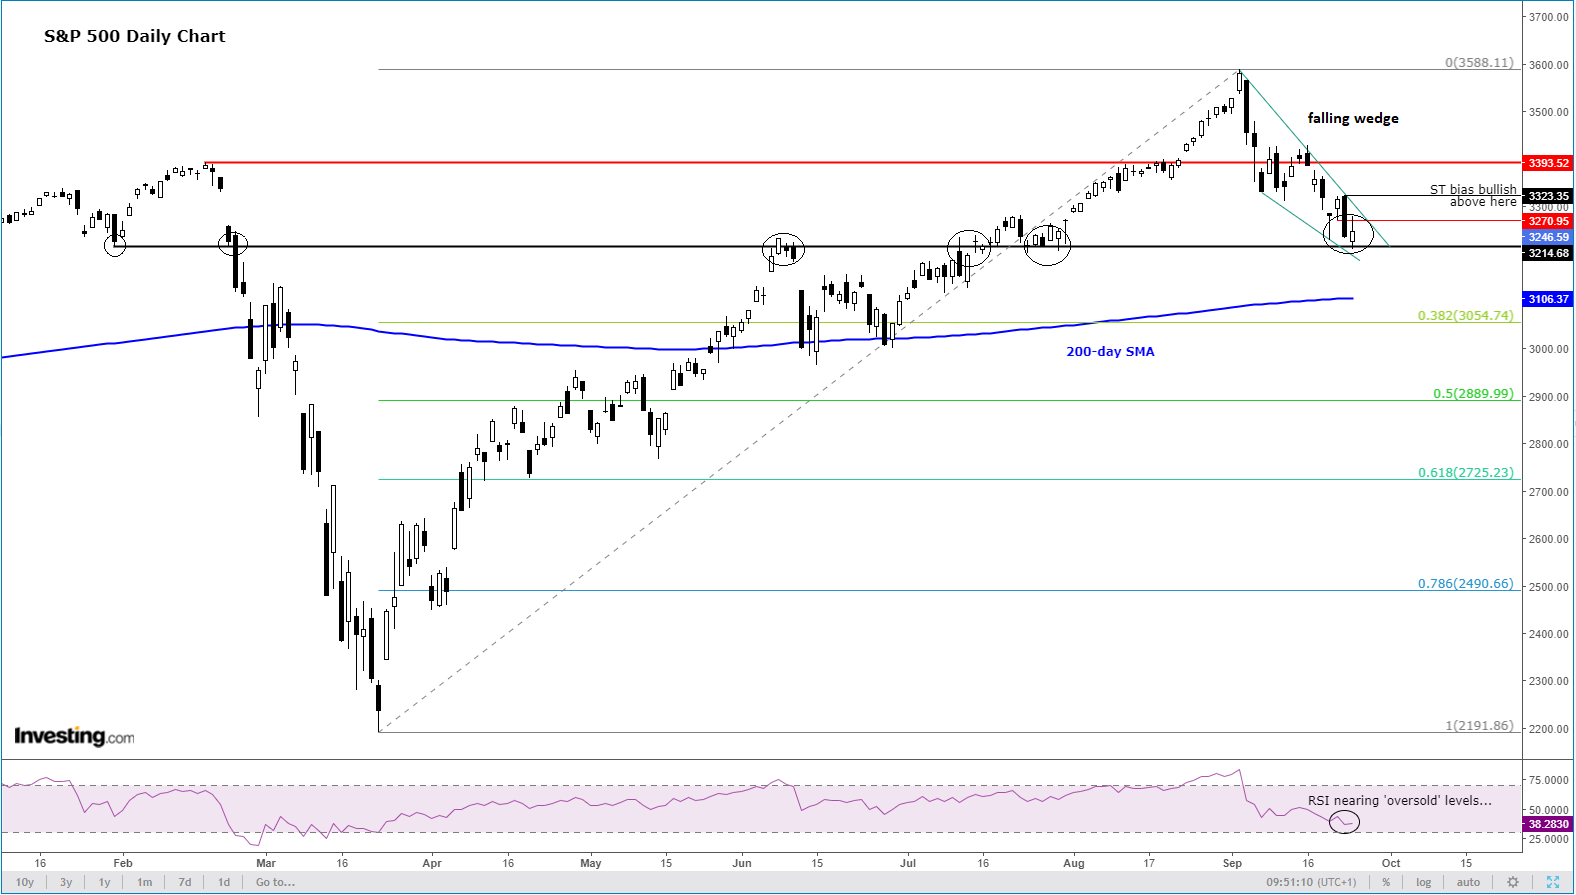
From a technical point of view, the S&P has now reached a critical juncture after its recent falls:

As the daily chart shows, the index has been very sensitive around the 3214/3215 area in the past, where we have seen good bounces and rejections from. And it was precisely here where the index once again reacted from on Thursday, as it started to turn higher after being in the red earlier in the day.
But was this bounce an oversold reaction, or a sign of things to come in the next few sessions?
Well, some would argue that the RSI was at bear oversold levels and after a 10% correction you are bound to see some dip-buying at or near support. This view is precisely how I would describe Thursday’s reaction.
For confirmation, I would now like to see the S&P stage a breakout from the falling wedge pattern it has been stuck inside for the past month or so. The falling wedge is a bullish continuation pattern. So, a decisive break above it would be deemed a bullish development.
Thursday’s reaction was nice, but it now needs to break out of this falling wedge—and soon. Otherwise, there is a risk we could see further falls in the near-term. Indeed, a daily close below 3214 could see the index drop towards its 200-day average at 3106, or even lower, in the coming days.
But even if this bearish scenario plays out, it is worth remembering that in the grand scheme of things, the correction from the record highs has been relatively shallow thus far. The index has not even retraced to its 38.2% Fibonacci level (3054) yet. This means that objectively, the long-term bullish trend remains intact and traders should be prepared for a sudden short-squeeze rally to potentially emerge, even if the macro backdrop may suggest otherwise.
