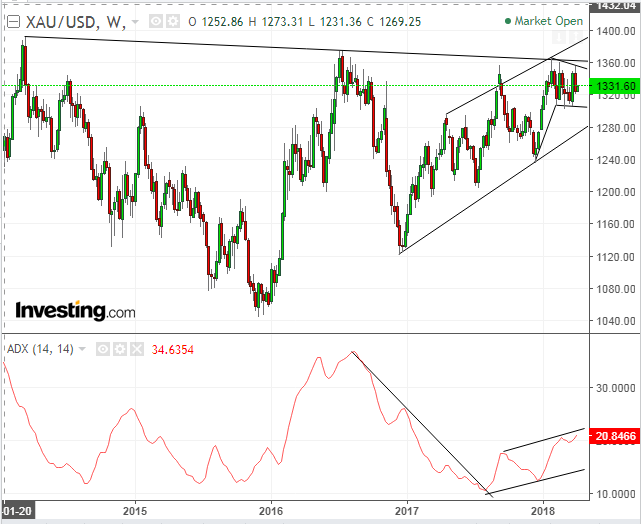
Earlier this morning, China retaliated against US tariffs on its steel and aluminum exports by levying duties on a variety of US goods, up to a 25 percent import taxes depending on the items. However, China left out some of the biggest exports from the US, including soybeans. As this potential trade war heats up and investors try to measure market sentiment, it's helpful to watch everyone's favorite safe haven asset – gold.
Is This A Trade War?
It could be argued that the number of products China has subjected to tariff is relatively small compared to expectations. Today's return tariff-salvo is merely symbolic, indicating that China is eager for negotiations. However, many traders may not be privy to such a nuanced view. Even more sophisticated traders may cause a self-fulfilling prophecy by selling off equities.
Additionally, other voices in China—some calling for stronger retaliatory measures on agricultural products and big-ticket US goods such as Boeing (NYSE:BA) aircraft—may prevail in the growing trade-war narrative.
Last week, two days of US equity gains, on Monday and Thursday, saved stocks from falling into a downtrend. At that time, investors were relieved by what appeared to be easing trade war tensions. However, should today's Chinese response snowball, investors would return to the risk-off mood seen during the week before last, which provoked the worst weekly selloff in two years.
As we've mentioned before, when trying to understand the market's mind it's important to measure the supply-demand balance in the world's oldest safe haven asset, gold. We've been tracking trade on the precious metal for some time now, watching as it's been developing a potential massive 5-year bottom.
We have monitored its medium-term consolidation since the beginning of the year, beneath the top of a consolidation since 2013.
The presumption of a consolidation is that gold would then resume the prevailing trend, after a period of profit-taking and indecision. The Average Directional Index (at bottom of chart) measures the strength of a trend. It provided an upside breakout in August 2017 and has been rising since, along with the price up-channel. However, surprisingly, it has been rising throughout the price consolidation.
The importance of the midterm consolidation since late January is that its upside breakout would coincide with an upside breakout to the massive, 5-year bottom as well.
The two-month consolidation's implied target is about $1,370, but the 5-year bottom's implied target is $1,750. That target will likely coincide with a stock market crash.
Trading Strategies - Long Position Setup
Conservative traders would wait for an official bottom, with a penetration of the $1,366.13 high on January 22, followed by a correction that will not fall below the $1,350 consolidation top.
Moderate traders would either wait for an upside breakout above the $1,356 level or to a correction to the range's $1,305 bottom.
Aggressive traders may enter now a long position, with a stop-loss beneath Friday's $1,321 low.

