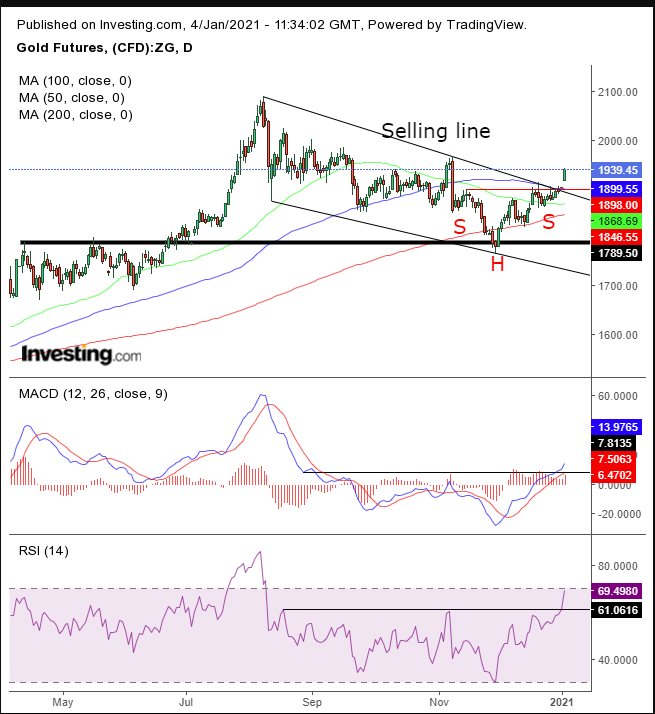
Gold surged on Monday to start the new year on a high note, gaining 2.3%. The precious metal broke free of its stifling falling channel, as the dollar drop extended.
Gold, which is priced in USD, and the greenback share an inverse relationship. The dollar’s attractiveness as an investment changes according to its yield. Real yields, which fell during the course of 2020—and represents the difference between nominal benchmark bond yields and the rate of inflation— are now at -1.092%, last year’s low.
Gold’s value rises and falls in mirror image.

Since November, gold has completed a H&S bottom. The pattern allowed bulls a chance to regroup in order to break the bearish selling line.
Note that the H&S synchronized precisely with the falling channel. Additional technical signals point to the 100 DMA as the center of technical pressure, where the H&S neckline meets with the channel top and the April-June resistance support the falling channel.
The MACD and RSI both bottomed. The 50 DMA began curving upward, away from the 200 DMA.
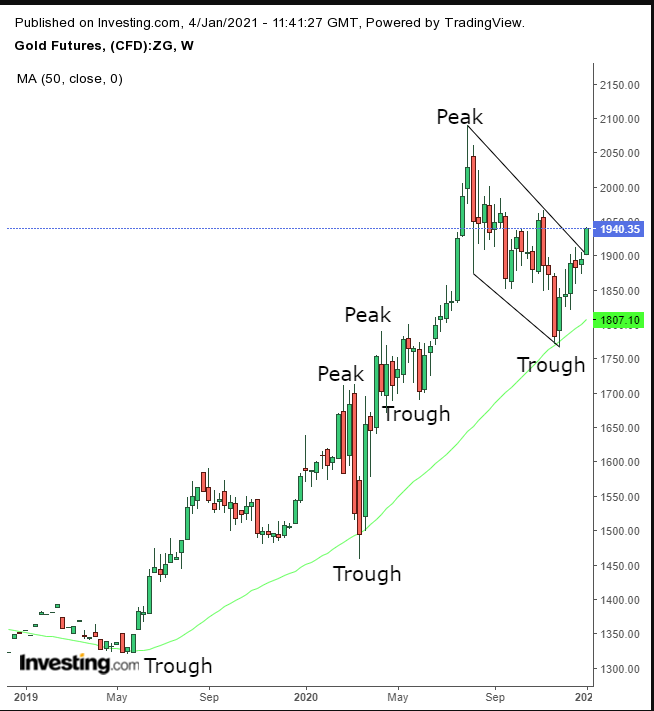
Here’s another indicator that the yellow metal will continue higher over the long-term:

Note the trajectory of the 50-Week Moving Average. It suggests the long-term trend is up.
Trading Strategies
Conservative traders should wait on a long position for a new high in the medium term, which would overtake the Nov. 9 high, to be followed by a return move to confirm the support of the H&S, channel top and 100 DMA.
Moderate traders would wait either for the November high to be taken followed by support, or for a return-move toward the $1,900 level.
Aggressive traders could go long, provided they understand they’d be chasing the price, be exposed to whipsaws and have a tough time finding a sensible risk:reward ratio between the support of the breakout and resistance of the November high. Therefore, we’d urge patience.
Wait for the price to reach either a support for a long, or a resistance if you want to risk a short, or wait for its breakout, for a long beyond that point.
Trade Sample 1 – Contrarian Short Position
- Entry: $1,960
- Stop-Loss: $1,966
- Risk: $6
- Target: $1,900
- Reward: $60
- Risk:Reward Ratio: 1:10
Trade Sample 2 – Long Position
- Entry: $1,910
- Stop-Loss: $1,900
- Risk: $10
- Target: $1,960
- Reward: $50
- Risk:Reward Ratio: 1:5
